
← Back To Blog
Automated Business Intelligence: A Practical Guide
Teams frequently don't have a data problem anymore. They have a decision bottleneck. Dashboards pile up, filters get tweaked, weekly exports get forwarded, and the person who needs the answer still asks for it after the meeting has already moved on.
That's where automated business intelligence starts to matter. It isn't just prettier reporting or a faster refresh schedule, it's the shift from people pulling numbers to systems pushing the right insight at the right moment, with enough governance that teams can actually trust what they see.
What Automated Business Intelligence Really Means
A sales lead reviews a dashboard on Monday morning, sees nothing urgent, and walks into a customer call. By lunch, the market has shifted, a competitor has changed pricing, and the lead only learns about it hours later through a manual report someone exported after the meeting. That delay is the difference between a team that reacts and a team that misses the window.
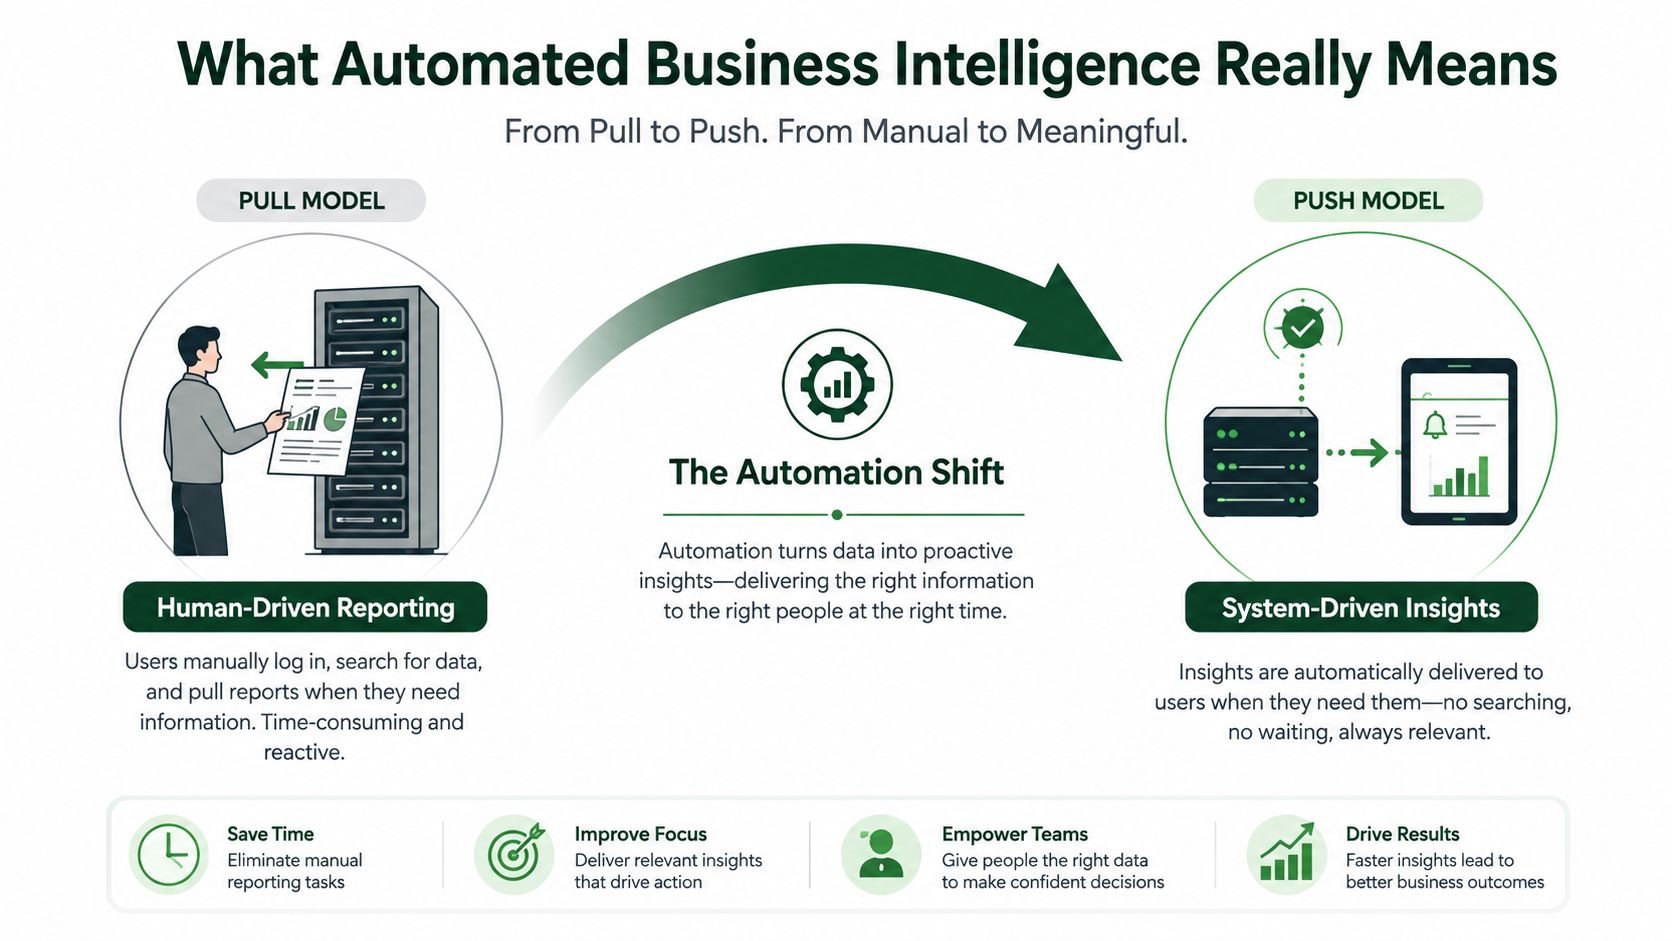
Automated business intelligence changes the direction of the work. Instead of analysts constantly pulling reports, the system pushes updates, alerts, and recommendations into the places people already work. A useful resource on the broader AI analytics shift is Menza on AI-powered analytics, especially if you want a plain-language overview of how automation fits into modern BI.
Push is not the same as scheduled
A lot of teams confuse scheduled refresh with automation. A dashboard that updates every night is still a dashboard, just with less manual upkeep. True automation usually includes data refresh and distribution, reporting, monitoring, and ad hoc analysis, not just a cron job that makes the same chart newer.
That distinction matters because a system can refresh on time and still leave people doing the work that creates decisions. When BI is automated well, the insight travels to the user, not the other way around. That's why modern coverage of automated BI increasingly includes AI copilots, embedded alerts, and workflow-triggered actions, not just static reports.
The category has also moved from experimental to mainstream investment. One industry summary places the global AI in business intelligence market at USD 8.57 billion in 2023 and projects USD 25.4 billion by 2030 at a 17.0% CAGR; the same source says adoption rose from 35% in 2020 to 68% in 2023 and that 72% of organizations were investing in AI for BI by 2023. That growth shows automation is no longer a side project, it's becoming part of core operating infrastructure.
Practical rule: if the only change is that a report arrives on a schedule, you haven't automated decision-making yet. You've only automated delivery.
The Core Components of an Automated BI Stack
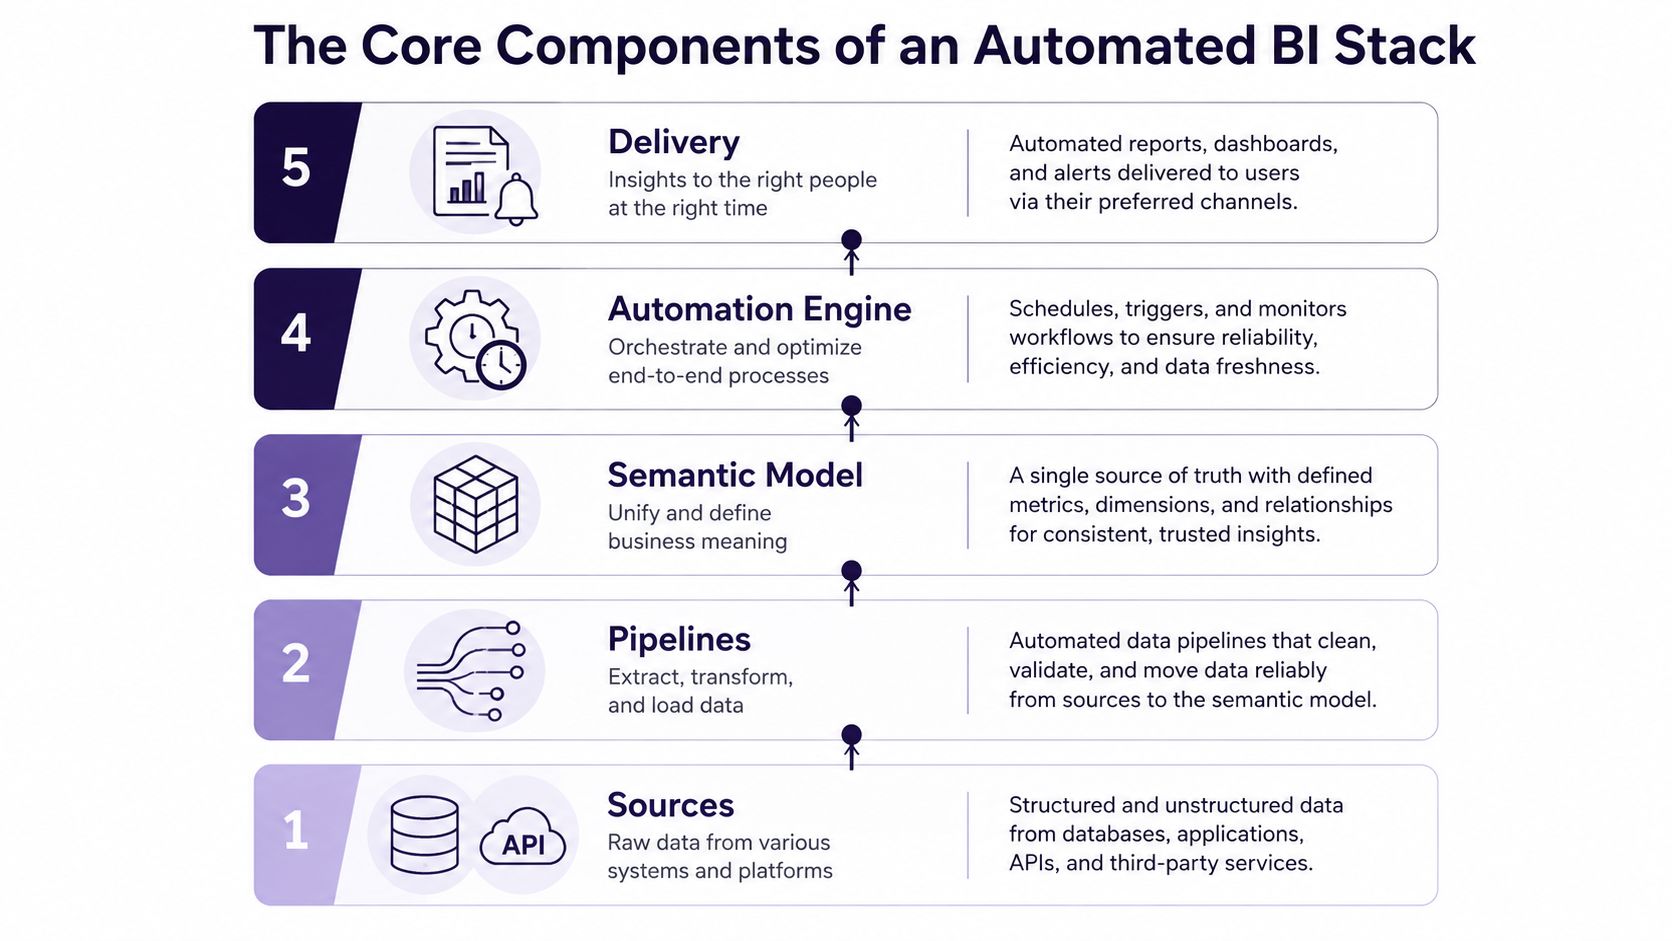
Think of the stack like a coffee shop. Beans come in, the roast follows a consistent recipe, the barista uses the same standard, and the drink gets served where customers are standing. Automated BI works the same way, except the ingredients are data sources, the roast is the pipeline, and the recipe is the semantic model.
Sources and pipelines come first
The first layer is data sources, things like CRM records, billing systems, support logs, spreadsheets, and APIs. If those sources are fragmented or inconsistent, automation just makes confusion faster. Independent guidance on AI agents in BI says automation works best when sources are integrated and cleaned, with standardized formats and taxonomies already in place, plus clear governance and access controls.
The next layer is the pipeline, facilitating the movement, transformation, and preparation of data for system use. If the pipeline breaks, everything above it breaks too. In practice, teams often discover that a changed field name in a source system has rendered five dashboards unreliable.
The semantic model is the quiet hinge
The semantic model is where metric definitions live. It is the part that says what a “qualified lead,” “active customer,” or “net revenue” means. Without that layer, one team reports one number, another team reports another number, and both think they're right.
That shared language is why automation can scale. If the same metric means different things to sales, finance, and operations, then automated alerts will create arguments instead of clarity. A strong semantic layer reduces that confusion before it reaches the dashboard.
A good semantic model is like a shared dictionary for the company. Without it, the system can still speak, but people will keep translating the numbers in their heads.
Automation engine and delivery surface
The automation engine decides what happens next, whether that means refreshing reports, sending alerts, triggering a workflow, or surfacing an exception for review. A practical guide to Server Scheduler AWS tools is useful if you want to think about orchestration and scheduled delivery in a more operational way.
The final layer is the delivery surface, the place where people see the result. That might be a BI dashboard, email, Slack, a CRM panel, or an embedded app. The key is simple, the insight has to arrive where the decision is happening, not in a report archive no one opens.
For a concrete example of a workflow that combines reporting, outreach, and analytics in one place, the internal overview at this Earlybird AI platform page shows how automation can sit inside an operational tool rather than live as a separate reporting island.
Real-Time Versus Scheduled Automation
Not every decision deserves instant automation. Finance close, audit checks, and weekly pipeline reviews often work better on a schedule because consistency and traceability matter more than speed. A clean end-of-day rollup can be more valuable than a half-correct live number.
Real-time automation earns its keep when delay changes the outcome. That includes live alerts, anomaly detection, and marketplace decisions where a late response loses the opportunity. If a bidder or seller needs to react inside minutes, a scheduled report is too slow to matter.
Use the decision clock, not the feature list
The easiest way to choose is to ask, how stale is too stale for this decision? If the answer is “by tomorrow it's fine,” scheduled automation probably fits. If the answer is “after this call, the deal is gone,” you need event-driven logic.
Practical rule: use real-time only where delay costs money, trust, or control. Everywhere else, favor scheduled automation because it's easier to govern and easier to audit.
This is also where a lot of teams overbuild. They ask for live everything, then discover that live everything creates noisy alerts, rushed reactions, and a constant need to explain why an event fired. Scheduled automation is less glamorous, but it often supports cleaner operating habits.
One of the clearest examples is a marketplace seller watching bidding and outreach. A live decision loop can support fast replies, live prioritization, and immediate follow-up. A finance team, by contrast, often needs a single reliable close, not a stream of partial updates.
The market is moving toward more embedded automation, but that doesn't mean every workflow should become real-time. The right design is usually selective, with the time-sensitive parts automated quickly and the high-risk parts held for human review.
Business Benefits and the Real ROI
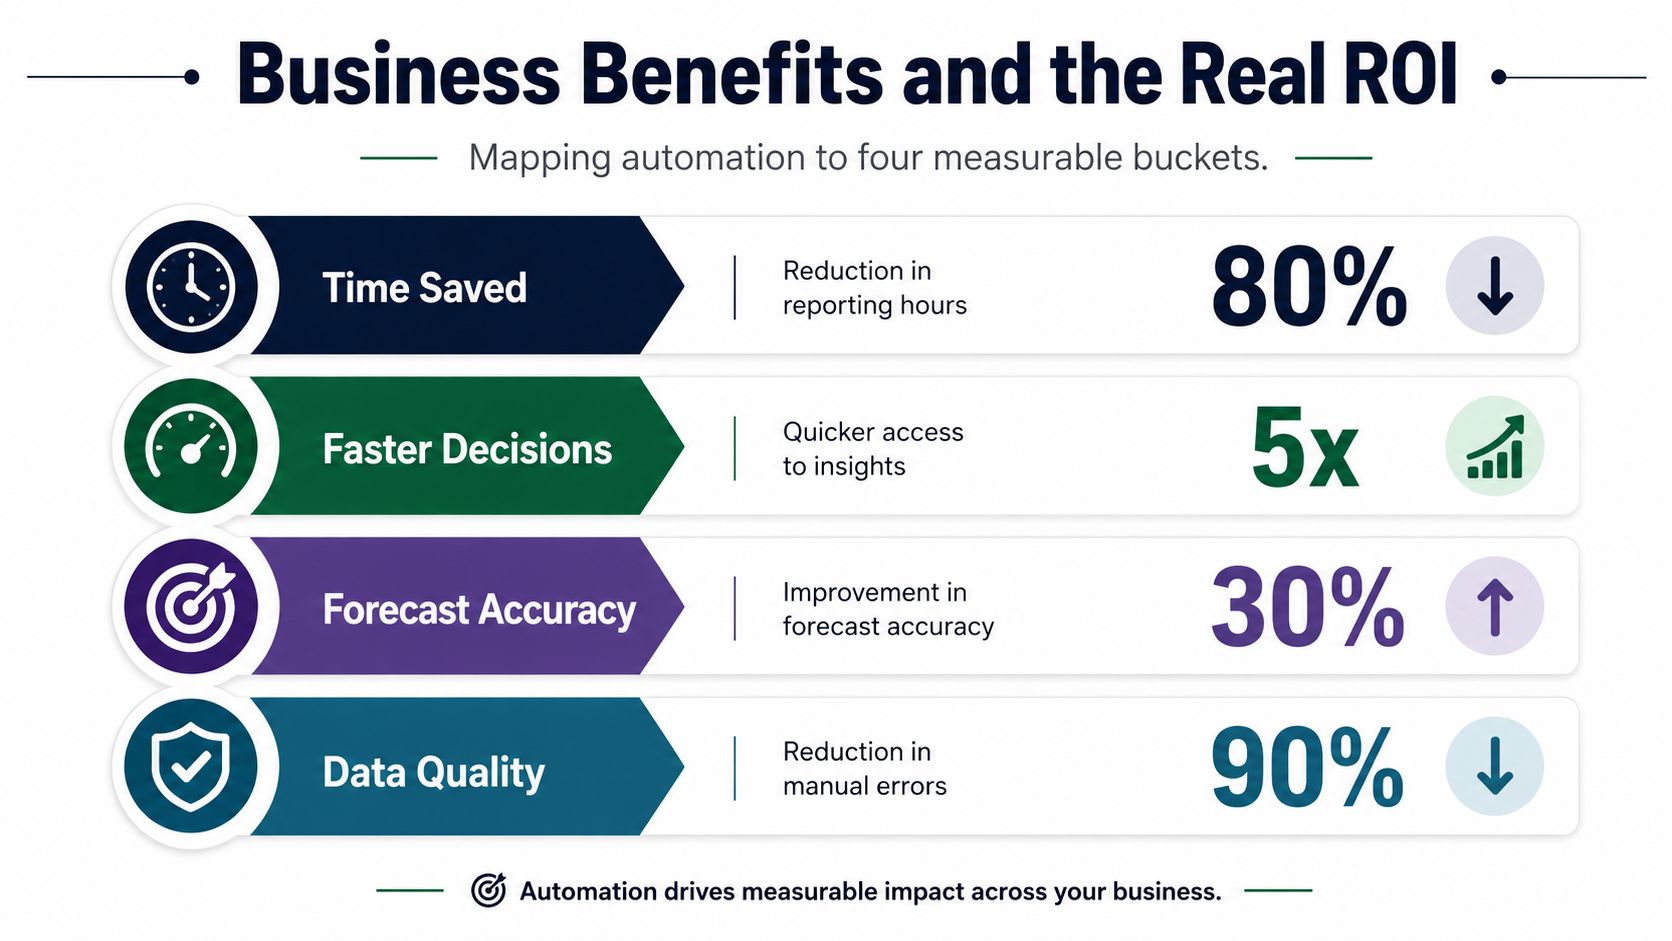
Automation is easiest to justify when it saves time, but that's only the first layer of value. The deeper case is that it changes the quality of decisions and the cost of making them. A cleaner view of ROI comes from separating efficiency gains from decision gains.
The evidence points in the same direction. A systematic literature review on AI-powered BI reports that AI-driven automation reduced manual data processing by 70%, while predictive analytics improved forecasting accuracy by 35% to 50%. That combination matters because time saved is visible fast, but better forecasts compound inside planning, staffing, and budget decisions.
Efficiency shows up first
The fastest win is usually lower manual reporting effort. Instead of rebuilding the same spreadsheet every week, teams get refreshes, alerts, and preformatted views automatically. That doesn't just save labor, it reduces the lag between a data change and a team seeing it.
A separate BI statistics roundup says the global BI market is projected to reach USD 54.9 billion by 2026, with cloud-based BI making up 65% of deployments and self-service BI growing 31% year over year as business teams reduce dependence on IT. The same source reports that enterprises using BI see a 15–20% increase in revenue from data-driven decisions, BI implementation reduces operational costs by an average of 28%, and mature BI capabilities can produce 30% higher ROI on data investments. Those figures matter because they connect automation to business outcomes, not just dashboard convenience.
For teams that need a framework to estimate whether the economics work, enterprise automation ROI methodology is a useful companion reference. It helps separate direct labor savings from the bigger value of faster, better decisions.
Strategic ROI compounds inside daily work
The harder value to measure is trust in decision flow. When managers rely on the same metrics every day, fewer meetings get spent debating whose spreadsheet is correct. That reduces friction, and friction reduction rarely appears in a dashboard, even though it changes performance.
The summary from the earlier section matters here too. When AI in BI keeps moving from niche use into mainstream investment, the business case stops being “Can we automate this report?” and becomes “Can we run the operation with fewer delays and fewer blind spots?” That's a much bigger question, and it's why mature BI programs usually outperform the original business case.
Implementation Roadmap and Best Practices
The best rollout starts with one workflow, not twenty. Teams that jump straight to broad automation usually end up debugging data quality, ownership, and adoption at the same time. A staged path keeps the work honest.
Start with readiness, not ambition
First, assess readiness. Check whether the team has defined metrics, usable data sources, and a clear owner for each dataset. If people can't agree on what a key metric means, automation will only hard-code the disagreement.
Next, clean and unify the data. That means consistent naming, reliable joins, and fewer manual exceptions. If your source systems still need constant human patching, the automation layer will inherit those patches and turn them into hidden risk.
Pilot one high-frequency use case
Then choose one repetitive workflow that happens often enough to matter. A good pilot is a task the team already does by hand, where mistakes are visible and the benefit of speed is easy to see. Automation works best on tasks that are frequent, repetitive, and data-driven, because those are the places where human attention is wasted on mechanical work.
Earlybird AI is a practical example of that logic in a marketplace setting. It connects to an Upwork account, learns from simple thumbs-up/down feedback, and automates proposal submission within about ten minutes of a job posting, with replies landing in under five minutes. It also feeds real-time analytics back to the user, which makes it a useful model for how operational automation and decision visibility can sit in the same workflow.
The same principle shows up in its guidance for agencies, where how to automate repetitive tasks becomes less about replacing people and more about removing low-value repetition. The point is not that every team should copy a marketplace tool. The point is that a narrow pilot can prove whether the stack is trustworthy before anyone scales it.
Expand, then govern
Once the pilot works, expand to adjacent teams or use cases. Keep the instrumentation in place so you can see what changes when more users and more data flow through the system. If every expansion creates a new support burden, the rollout is too fast.
Don't scale a workflow you can't explain in plain language to the person who owns the outcome.
The final stage is governance. That means approval paths, audit trails, and role-based access. If the workflow can trigger action, someone has to own the exception path. Through these measures, automation becomes a managed capability instead of a collection of clever shortcuts.
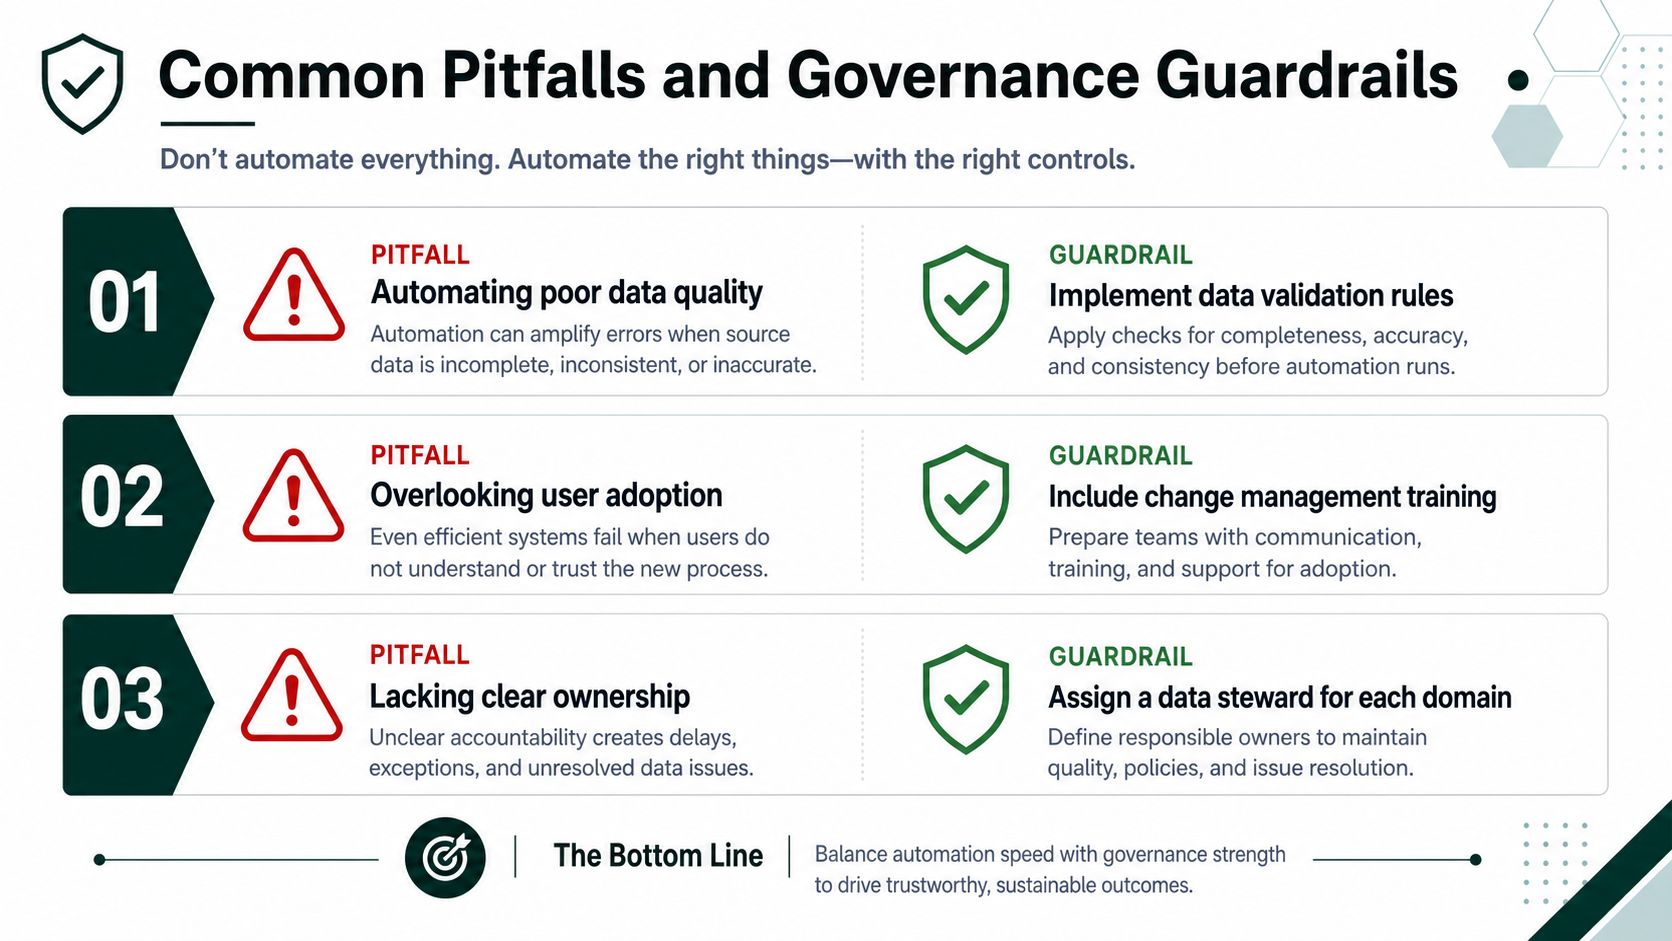
Common Pitfalls and Governance Guardrails
Most automation failures don't come from weak models. They come from weak foundations. Teams want the convenience of self-service and the speed of AI, but they often skip the operating rules that make both safe.
The common traps
One trap is adopting self-service analytics before the basics are ready. Implementation guidance from a BI vendor says organizations should not move into self-service before metric definitions and role-based access control are in place, and should not push into predictive analytics before they have at least two years of clean historical data. That's a readiness issue, not a technology issue.
A second trap is trusting augmented analytics too early. Trend research cited in the brief says companies under 500 employees saw a 68% failure rate when augmented analytics was implemented before cloud BI, governance, and ML infrastructure existed. The message is blunt, automation can amplify bad decisions if the groundwork is weak.
The third trap is removing human checkpoints. In high-stakes environments, a recommendation that looks clean on a dashboard can still be wrong, misleading, or poorly timed. The risk isn't just error, it's speed plus error.
Guardrails that actually help
- Define metrics once. Put the meaning of key numbers in one place, then stop letting every team rewrite them.
- Lock role-based access. If everyone can see everything, or trigger everything, the system gets harder to trust.
- Require audit trails. Any automated action should leave a trace that someone can review later.
- Keep humans on exceptions. Let the system handle the repeatable cases, then route edge cases to a person.
A recent BI trend source also warns that more automation can backfire when governance maturity lags behind capability. That's why selective automation often beats maximal automation in real organizations. The healthiest programs don't treat governance as a tax, they treat it as the feature that makes automation usable.
Measuring Success With the Right Metrics
A BI program becomes real when someone can measure it without guessing. The scorecard should cover four layers: adoption, speed, decision quality, and business impact. If you only measure one of those, you'll miss the part that matters most.
For adoption, track active users and queries per user. For speed, track time-to-insight and alert-to-action latency. For decision quality, watch forecast accuracy and anomaly catch rate. For business impact, watch revenue per analyst, cost per report, and pipeline contribution.
Log the first signal early
The first thing to log is usually the event that starts the workflow. If the system sends an alert, log when it fired, who saw it, and what happened next. If it refreshes a report, log the refresh time and whether anyone opened it.
That simple discipline keeps the program from becoming invisible. You can't improve a workflow you never instrumented, and you can't defend automation if you don't know how often people use it. For teams comparing operational reporting models, SEO agency reporting is a helpful example of how recurring insight delivery can be measured without turning into busywork.
The goal isn't “fewer dashboards” for its own sake. With AI copilots and embedded automation spreading, the ultimate goal is fewer unanswered questions and fewer decisions waiting on manual prep. That's the operating model to build toward through 2026.
If you're trying to automate analytics without losing control, Earlybird AI is a practical place to start looking at how live data, workflow automation, and response timing fit together. Visit Earlybird AI to see how a system can turn repetitive outreach and reporting into a managed, measurable process.