
← Back To Blog
Competition Analysis Table: Build and Use One in 2026

You've got three tabs open, a client wants “a quick competitor view” before the pitch, and the spreadsheet you started this morning already looks like a landfill of feature notes, pricing scraps, and half-finished opinions. That's usually the moment people realize a competition analysis table isn't hard because of the research. It's hard because the structure keeps letting judgment leak into the facts.
A usable table does more than collect names. It forces a team to decide what matters, how to score it, and when to revisit it. That governance layer is what makes the difference between a worksheet that impresses nobody and a matrix leadership can defend.
Why Most Competition Analysis Tables Fail Before They Start
The first failure happens before the first competitor is entered. Someone opens a spreadsheet, adds a few rival names, then starts dumping in whatever is easiest to find, homepage claims, random feature notes, a pricing sketch, maybe a review quote. By the time the grid looks “full,” it's already untrustworthy, because the cells were filled without a shared method.
That's the trap I see most often in pitch work. The table looks organized, but the team can't explain why one competitor sits above another, or whether that ranking would survive a challenge from leadership or an investor. A competition analysis table only becomes useful when it turns rivalry into a repeatable comparison system, not a pile of observations. Canada's BDC recommends ranking competitors on a 1-to-10 scale in a simple grid before writing a strengths-and-weaknesses assessment, which is exactly the kind of discipline that keeps the conversation grounded in comparison rather than instinct, as outlined in BDC's guidance on evaluating competition.
The three structural failures
The first failure is mixing facts with interpretation. If one row says “demo-only pricing” and the next row says “seems expensive,” the table has stopped being evidence and started being commentary. That's where leadership loses trust, because they can't tell what was verified and what was guessed.
The second failure is the absence of a scoring model. A table without weights is just a list with extra columns, and lists invite argument. The weighted approach described in business guidance, where success factors receive weights that sum to 1, is useful because it makes the trade-offs visible and keeps low-value features from distorting the outcome, as reflected in the broader competitor-analysis method summarized on Competitor analysis.
The third failure is no refresh discipline. Markets change, pricing changes, messaging changes, and a table that wasn't dated starts lying by omission. A defensible matrix needs a date stamp, an owner, and a clear update rhythm, or it becomes a relic the day after the meeting.
Practical rule: if you can't say where a cell came from, who filled it, and when it was last checked, that row shouldn't influence a decision.
For a quick look at how competitive comparison can be framed across products, the see how stacks up resource is a good reminder that the table is only valuable when it supports a decision, not when it just catalogs differences.
Designing the Table Structure and Essential Columns
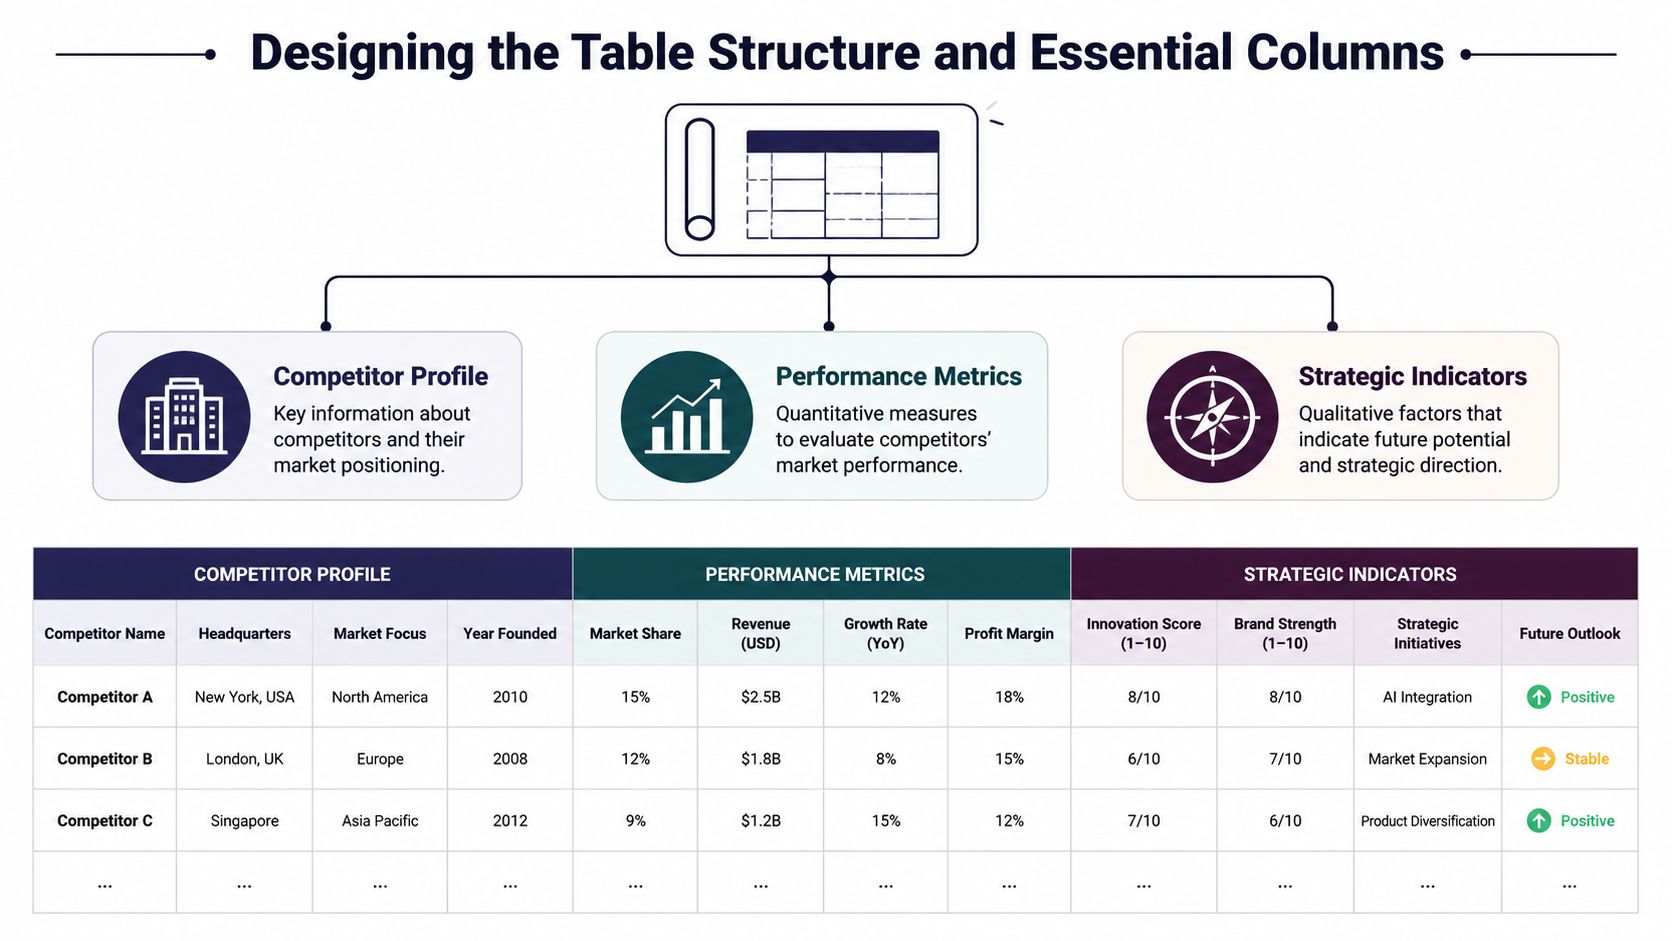
Start with the question leadership will ask first, “Why does this competitor belong in the table at all?” If the answer is vague, the row will drift between fact, opinion, and sales folklore, and no one will trust the comparison when it matters.
Build the required fields first
Every serious competition analysis table needs competitor name, analysis date, analyst name, and competitor tier. Those fields sound basic because they are. They give the table an owner, a time stamp, and a clear place in the market map.
Confluence's template also separates tier one, tier two, and tier three competitors, which is a practical way to keep the table honest about impact. A company that shows up in every deal deserves a different level of attention than a brand that only appears in occasional sales conversations, as reflected in Atlassian's competitive analysis template.
Once that spine is in place, add the fields that support the decision itself. Canada's BDC's 1-to-10 grid is a useful model because it turns a loose strengths-and-weaknesses discussion into a structured rating exercise before anyone writes a conclusion. Keep the raw observations in one place and the score in another so the judgment stays traceable instead of disappearing inside the row.
A good table also needs a clear link to the qualification criteria behind it, especially if the same matrix will inform pipeline reviews or market prioritization. For that, a practical lead qualification framework helps keep the columns tied to real buying signals rather than whatever looked interesting in a sales call.
Keep the scope tight enough to stay usable
The mistake I see most often is overbuilding. Teams try to include every adjacent brand, every aspirational player, and every vendor that came up once in a prospect meeting. The result is a bloated sheet nobody updates.
For deal-relevant analysis, focus on 3 to 5 direct competitors. If you are doing an early market scan, keep it to 5 to 10 at most so the table stays auditable and internally consistent, which aligns with the practical guidance in Figma's competitor analysis template. That scope is small enough to compare cleanly and large enough to surface market patterns without burying the team in noise.
A usable row usually holds the tier, a short positioning note, pricing status, and a few structured indicators such as feature depth or customer friction. Modern templates also include fields such as pricing comparison, customer friction points, and win/loss ratio, which makes the matrix more than a static summary. The point is to help you sort competitors by decision impact, not just list who exists.
Practical rule: if a column does not change a decision, cut it.
When I build this kind of matrix for client work, the cleanest version starts with a narrow scope, a dated owner, and one scoring language used everywhere. Anything else becomes rework later.
Building a Weighted Scoring Model That Holds Up
A scoring model is what turns a comparison sheet into something leadership can use without squinting. Without it, everyone ends up arguing over the loudest feature, the prettiest landing page, or the competitor with the most polished sales motion.
Use weights to separate signal from noise
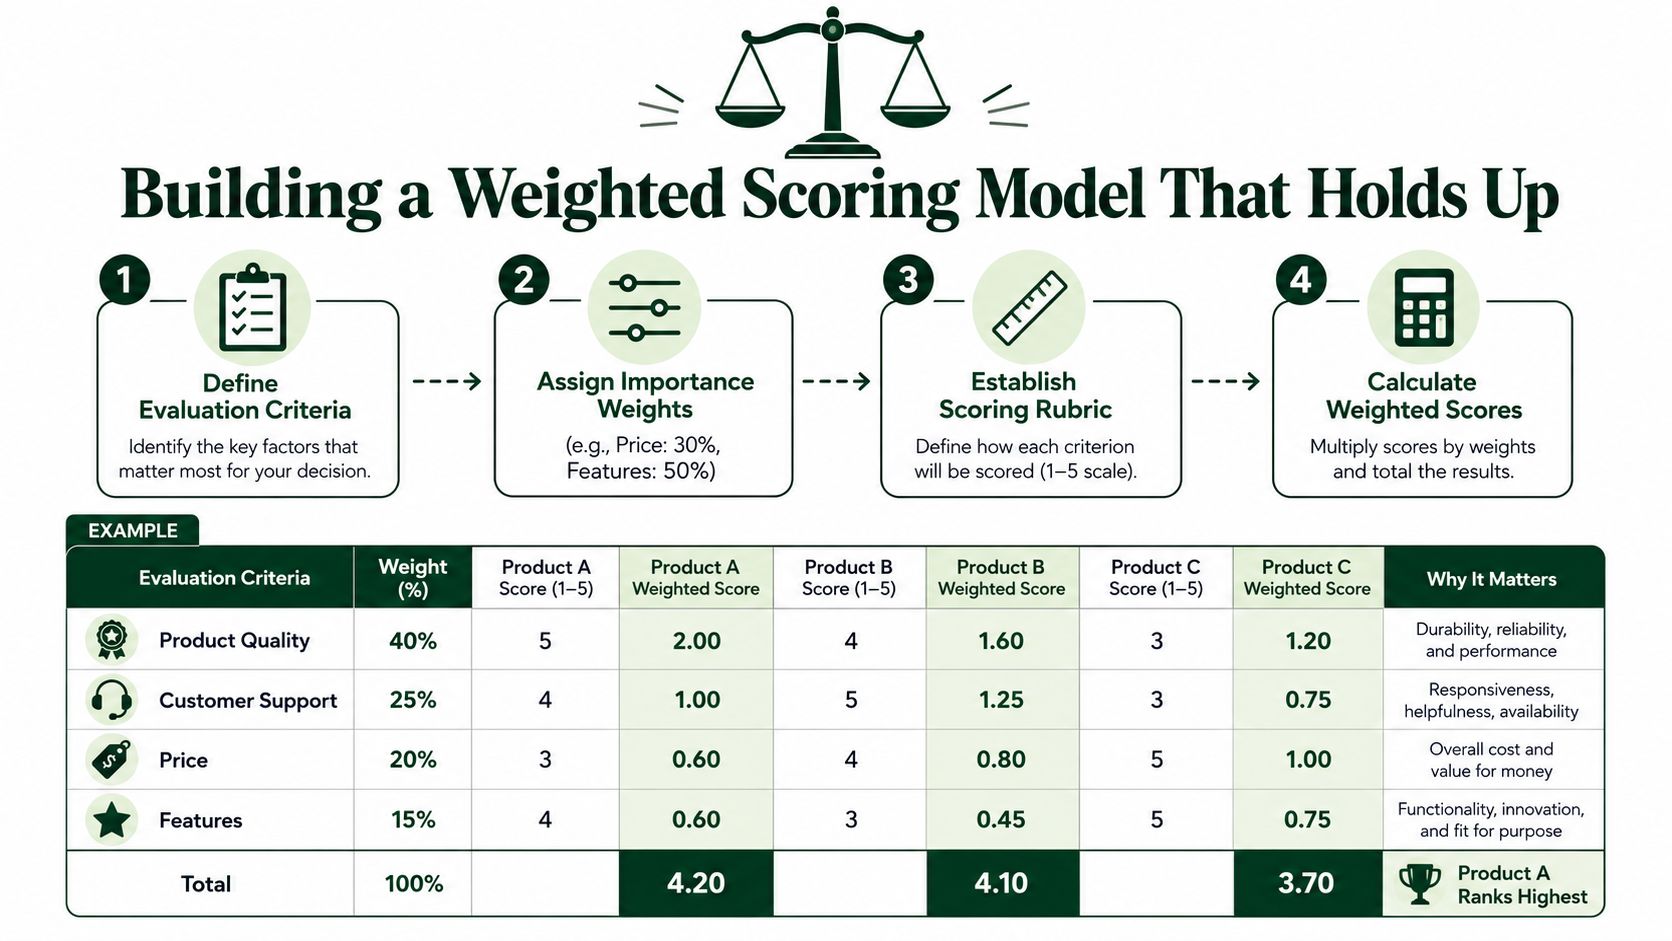
The discipline is straightforward. Define your comparison criteria, assign a weight to each one, score every competitor on the same fixed scale, and multiply score by weight to get the final ranking. The important part is not the arithmetic, it's the transparency. The weights must sum to 1, and the same rubric has to be used across the whole table, as described in the competitor-analysis method summarized on Wikipedia and reinforced by Smartsheet's competitive analysis examples.
That weighting step matters because it prevents low-value features from hijacking the final answer. A competitor can look exciting because it has a long feature list, but if those features don't affect buying behavior, the weighted score should push it lower than a smaller rival that's better on the criteria that matter. That's the difference between a flashy comparison and a defensible one.
Pick a scale and keep it stable
For most client work, I prefer a fixed 1-to-10 scale when the team needs nuance and a 1-to-5 scale when the table has to stay fast and simple. The scale itself matters less than consistency. Once the rubric is set, don't change it midstream because one competitor feels harder to score than the others.
This is also where numeric fields earn their keep. A mature table can include company size, pricing tiers, revenue, market position, and customer ratings where those figures are available and comparable, as noted in the broader template guidance on Competitor analysis. Those fields don't replace judgment, but they anchor it.
Here's a practical way to keep it sane:
- Product quality: score what's visible in the product, not what the homepage promises.
- Customer support: score from public review themes and documented response patterns.
- Pricing clarity: score whether the offer is easy to understand, not just whether it's cheap.
- Market fit: score how directly the competitor matches the use case you care about.
If a feature is impressive but irrelevant to the buying decision, its weight should be low. If a criterion changes the sale, it should carry more of the total. That's the math that makes the table useful in a room full of skeptical stakeholders.
For teams formalizing this logic inside a broader qualification process, the internal lead qualification frameworks guide pairs well with the same mindset. A good scoring model is really just a qualification system applied to competitors.
Sourcing Reliable Data for Every Cell
A competition analysis table only works if every cell can be traced back to a source you would be willing to show a client, founder, or investor. If the data trail is weak, the scoring model becomes a polished guess. The table may look disciplined, but it will not hold up under questions about where each number or label came from.
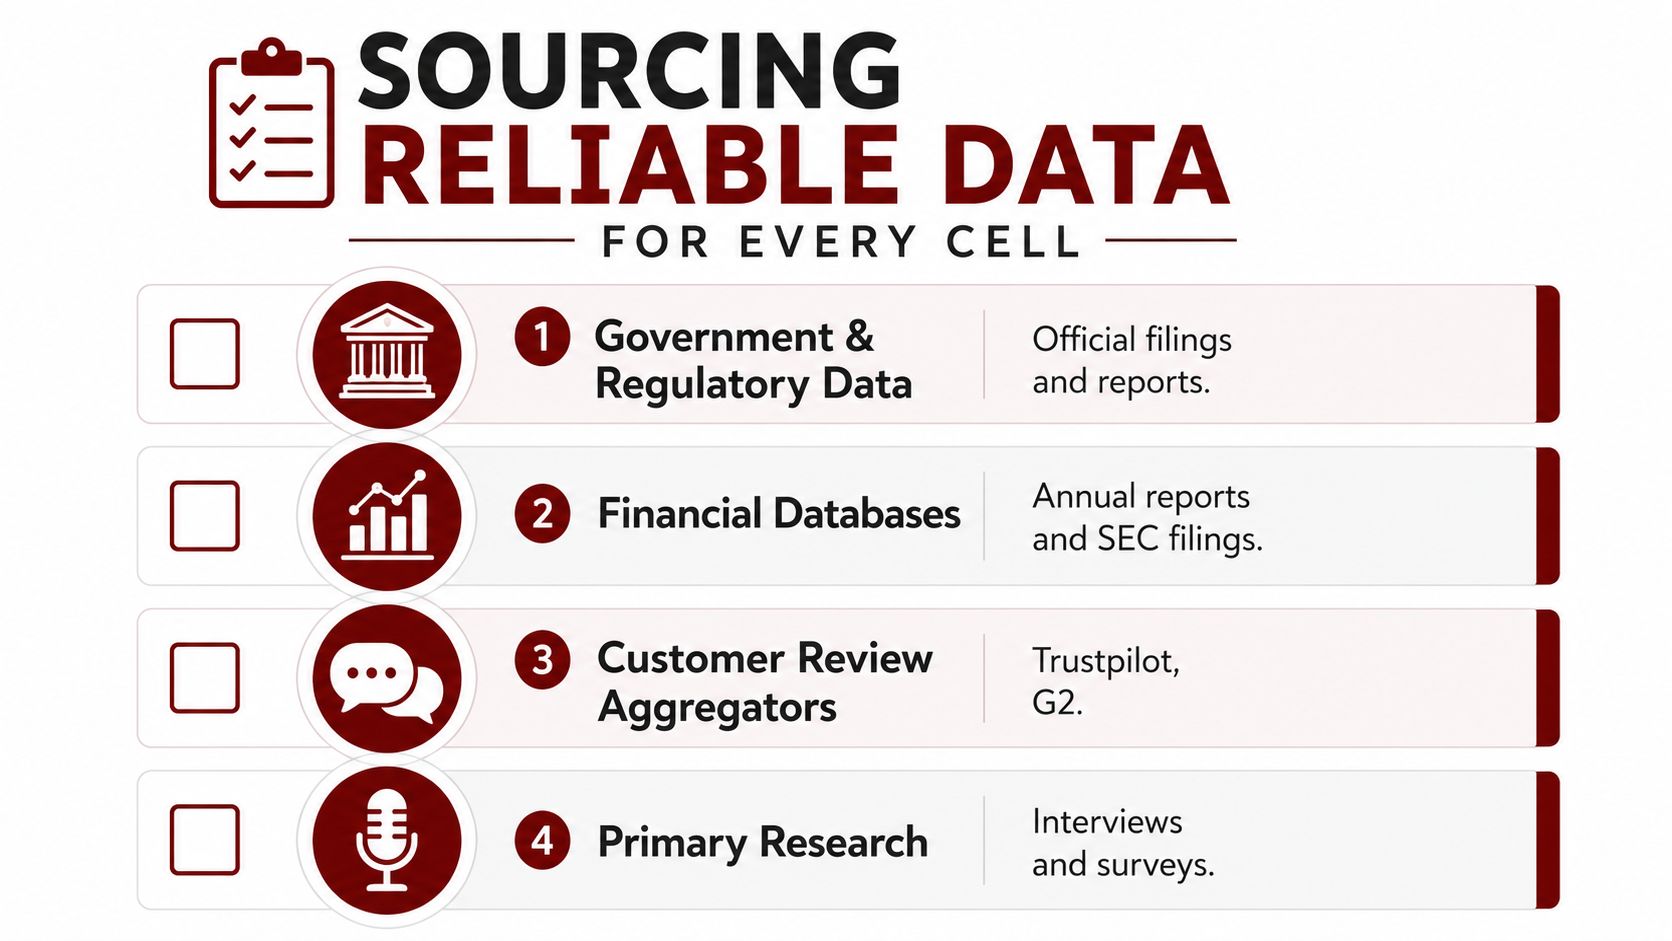
Use a source hierarchy, not a source grab bag
Start with sources that let every competitor be judged on the same terms. Homepage copy, pricing pages, feature pages, changelogs, and review themes are the first places I check because they are visible, repeatable, and easy to defend later. That approach lines up with Industry Lens's competitive matrix guidance, which is useful precisely because it keeps the matrix auditable after the meeting is over. If pricing is hidden, demo-only is still a valid observation, as long as you label it that way.
The order of sources matters. Homepage messaging shows how the company wants to be understood. Pricing pages show how it wants to be bought. Feature pages and changelogs show what has shipped. Review themes show the friction the sales page leaves out.
When a field needs a closer look over time, use Captapi monitoring software review as a reference for the kinds of signals teams track repeatedly. Keep the focus on source quality and recency, not on collecting extra noise. A row is useful only if the evidence behind it still reflects the market conditions it describes.
Document the source with the cell
Each cell should carry enough context that another analyst can retrace the work without guessing. Record what was checked, where it was found, and when it was reviewed, especially for fields that shift often. If a pricing page changed, a feature page moved, or a new complaint pattern appeared in reviews, that history should be visible in the row notes.
Review data needs extra discipline. Don't build a case from the loudest compliment or the sharpest complaint. Pull recurring themes from the same source class and keep them separate from one-off anecdotes or screenshots. That keeps comparison across competitors fair, which matters more than a dramatic example in one cell.
Stability also needs to be visible. Some descriptors change slowly, while pricing and feature depth move faster and deserve more frequent checks. That difference should show up in the table so reviewers know which rows are current and which ones need another pass.
Keep the source path boring. Boring is auditable.
For teams that want a cleaner intake process before scoring starts, the internal requirement gathering methods resource fits this discipline well. Better intake means less cleanup, fewer disputed cells, and a table leadership can trust when making important decisions.
Turning Table Insights Into Strategic Decisions
A table that doesn't change a decision is just documentation with a nicer layout. The value appears when the scores and source-backed observations point toward a specific move, and that move has to be concrete enough to survive a strategy review.
Read for gaps, not just ranks
The most useful pattern is the underserved area, the spot where several competitors score poorly on the same criterion. That's where positioning opportunities usually hide. If pricing clarity is weak across the board, for example, a cleaner offer can become part of the value proposition. If support themes are noisy in reviews, service quality can become a differentiator.
I like to separate the table into three decision buckets. First, positioning gaps, which shape how the company explains itself. Second, pricing opportunities, which shape how the offer is packaged. Third, roadmap priorities, which shape what gets built next. The matrix doesn't make those decisions for you, but it narrows the field fast.
Use the table in the room, not just in the deck
Agencies get the most benefit when the table shows up in client pitches as evidence, not ornament. A recommendation lands harder when it's tied to visible competitor patterns instead of a vague “we think this will work.” For freelancers, the same logic sharpens profile positioning and proposal language, because the table shows where the market is crowded and where your angle can be clearer.
That's why I prefer to turn each meaningful row into a next step with an owner and a deadline. If a rival owns the category narrative, the action may be a reframed headline. If a competitor is weak on onboarding or support, the action may be a feature emphasis or proof point in the sales flow. If pricing is muddled, the action may be a simpler package structure.
For a broader strategy lens that ties comparison work to agency positioning, the internal marketing strategy for advertising agency article is a solid companion. The table is most valuable when it feeds that kind of decision-making instead of living as a one-off deliverable.
Maintaining and Refreshing Your Table Over Time
The most common mistake is treating the matrix as a one-time project. Teams build it for a pitch, save the file, and then act surprised when it's stale a month later. That's not a tooling problem. It's an ownership problem.
Set the cadence before the table goes live
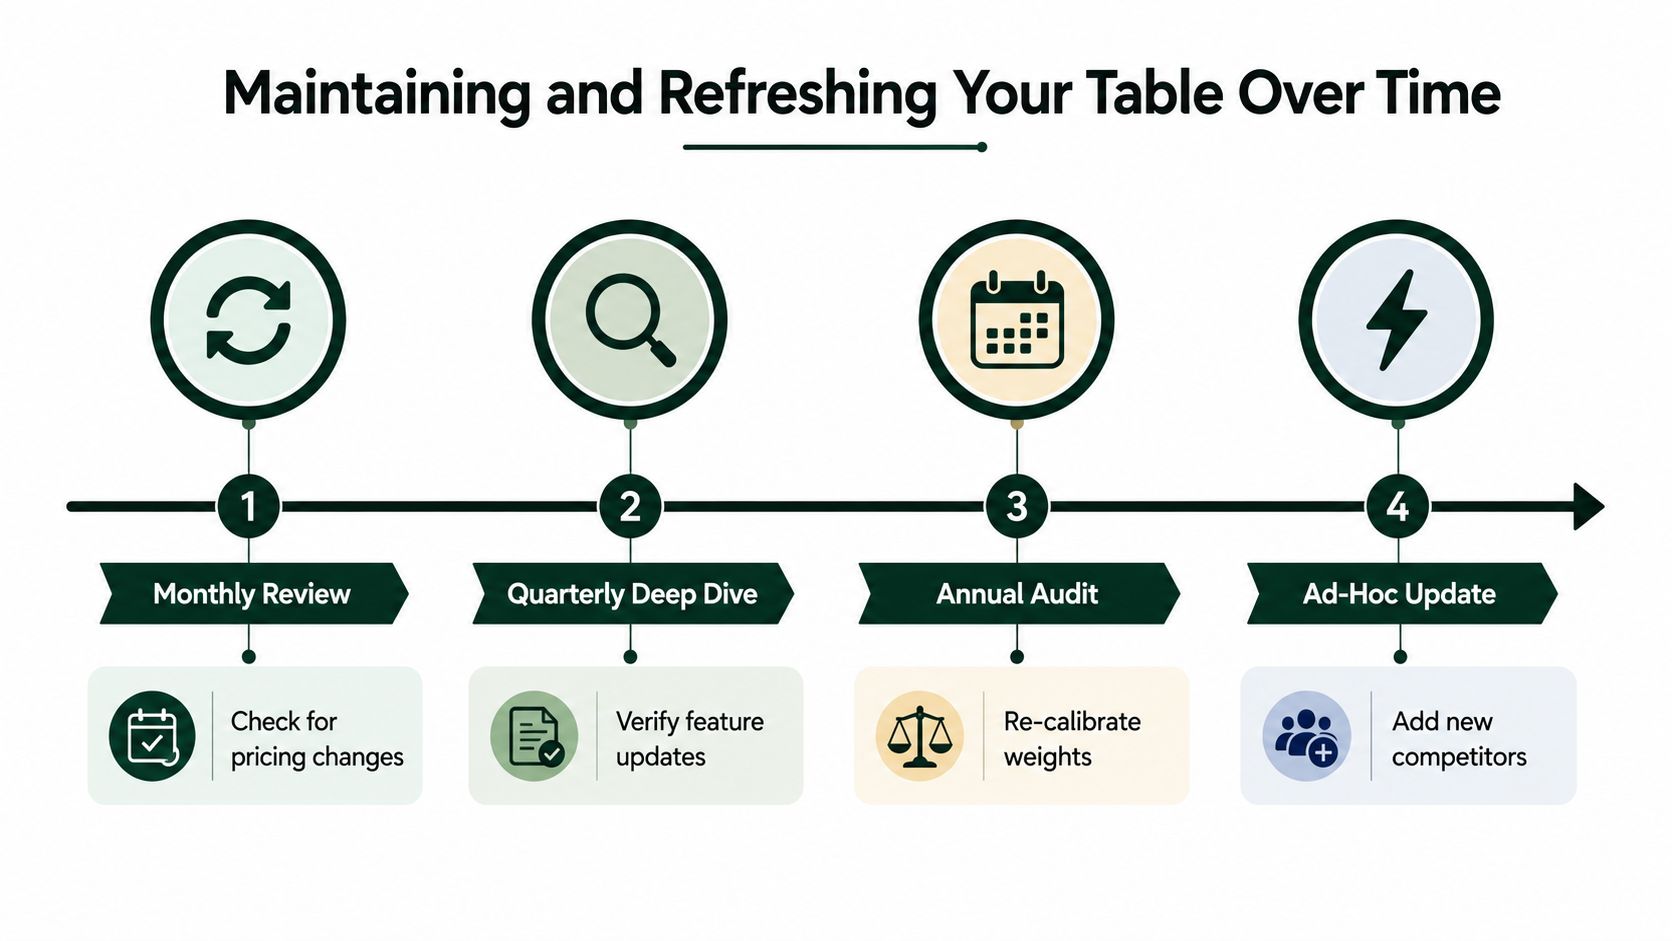
The practical rhythm is simple. Use quarterly updates for quick scans and a deeper annual review for the full matrix, matching the cadence described in the broader competitor-analysis guidance on Competitor analysis. That cadence is realistic because it keeps the table alive without turning it into a full-time job.
Fast-moving markets need more attention. When products change quickly, the table should treat some fields as time-sensitive and others as relatively stable. Pricing, feature depth, and competitor tiering tend to shift sooner than company background details, so those deserve the first update pass whenever something changes.
Assign ownership and version the file
If everyone owns it, nobody does. The table needs a named analyst or strategist who is responsible for refreshes, source checks, and version control. That person doesn't need to rewrite the strategy. They need to keep the data honest and make sure the rubric hasn't drifted.
Versioning matters because leadership will eventually ask what changed and why. A dated file with a clear owner lets you compare one review cycle against the next instead of arguing from memory. It also keeps the table from becoming a mystery spreadsheet that only one person understands.
A strong maintenance habit usually includes these four moves:
- Check pricing pages first: pricing changes are often the earliest sign of a repositioning.
- Verify feature pages and changelogs: capabilities move fast, and stale rows create false confidence.
- Re-score with the same rubric: keep the math stable so changes are visible.
- Add new competitors deliberately: don't let the scope creep without a reason.
That routine keeps the matrix usable across major markets and volatile product categories. It's not glamorous, but it's what makes the table credible when the next review meeting starts.
If you want a workflow that keeps competitive research, proposal speed, and sales follow-up moving without adding manual admin, take a look at Earlybird AI. It's built to help agencies and freelancers turn market intelligence into faster, more consistent outreach, which is exactly the kind of operational discipline a strong competition analysis table is supposed to support.