
← Back To Blog
Sales Efficiency Metrics: Drive Agency Profit in 2026
You're probably doing more sales work than you think.
You answer invites fast. You rewrite proposals late at night. You jump on calls, send follow-ups, tweak your Upwork profile, and keep one eye on delivery because the client work still has to get done. From the outside, it looks like momentum. Inside, it often feels messy. Revenue arrives, but not on a schedule you can trust. Some months look strong. Others disappear into fees, rework, and too much unpaid selling time.
That's the trap for a lot of freelancers and small agencies. They confuse activity with progress. Busy inbox. Busy calendar. Busy pipeline. Thin margins.
I see this most often with service businesses that win work through marketplaces like Upwork. They assume the problem is volume, so they send more proposals. Or they assume the problem is pricing, so they raise rates without fixing how they sell. Neither move helps much if the problem is that the sales process itself is inefficient.
Sales efficiency metrics give you a different lens. They help you answer practical questions that matter more than raw hustle:
- How much does it cost to win a client?
- Which sales activities produce revenue and which ones just eat time?
- Are faster wins turning into durable client value or just short projects with hidden churn?
- Can you scale outreach without wrecking profit?
For a services business, growth becomes a concrete reality. You stop judging your pipeline by how full it feels and start judging it by whether it creates profitable work. You stop treating every lead source the same. You stop guessing whether your outreach system is working.
That shift matters even more on Upwork because the platform rewards speed, relevance, and consistency. If your process is slow, generic, or manually stitched together, your acquisition cost rises even if your calendar stays full. If your process is measured, you can tighten response times, improve proposal quality, protect margins, and choose better clients.
Introduction Beyond Being Busy to Being Profitable
A common pattern shows up when an agency starts getting traction. The founder is finally winning projects regularly, but profit doesn't rise with the workload. One client needs revisions, another delays kickoff, and a third came in underpriced because the proposal was rushed. Meanwhile, the owner spent hours that week on lead searching, custom outreach, follow-up messages, and calls that never turned into signed work.
Nothing looks broken. That's why the problem lasts.
What busy looks like when efficiency is weak
In a service business, low efficiency usually hides behind respectable activity:
- More proposals than clarity. You're sending a lot, but you can't say which types of opportunities convert best.
- More calls than control. Discovery meetings fill the week, yet close rates stay uneven.
- More clients than margin. Revenue rises, but fulfillment strain and acquisition effort eat the gains.
- More tools than insight. CRM, inbox, calendar, spreadsheets, Upwork messages, and notes all exist, but they don't form one decision system.
A seller can look productive while the business gets less profitable.
You don't scale a service business by increasing sales activity alone. You scale it by making each unit of sales effort produce better revenue.
That's why sales efficiency metrics matter. They aren't enterprise jargon for finance teams. For a freelancer or agency owner, they're a way to see whether your sales engine is healthy enough to support growth. They tell you if your acquisition process is expensive, if your deal cycle is dragging, and if your client value justifies the effort it takes to win the work.
Why this matters on Upwork
Platform-based selling makes the issue more visible. Upwork compresses the sales cycle. Clients post, evaluate quickly, and often choose the provider who responds with a sharp, relevant proposal before everyone else floods the inbox. That environment punishes waste.
If you spend too much manual time qualifying bad-fit jobs, writing from scratch, or chasing weak leads, you don't just lose time. You lose position. The opportunity goes to someone with a tighter system.
Once you start tracking efficiency, the conversation changes. Instead of saying, “We need more leads,” you start saying, “We need better conversion from the leads we already touch,” or “We need to reduce unpaid selling time on low-fit projects.” That's the beginning of profitable growth.
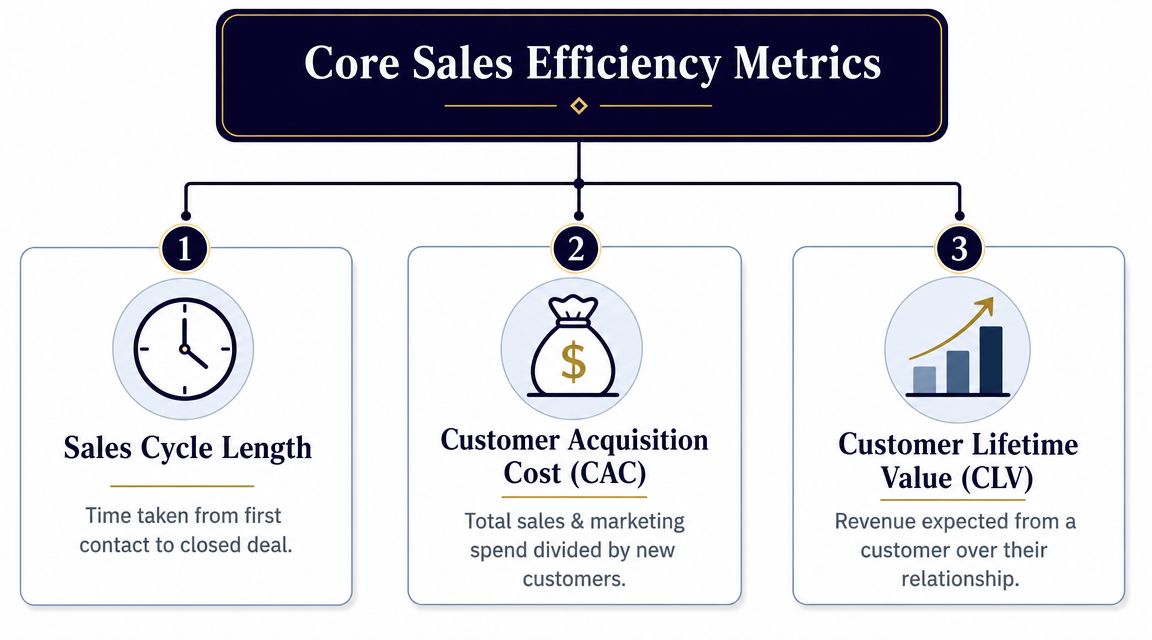
The Core Sales Efficiency Metrics You Must Track
Busy sales activity can still produce weak economics. For a service business, the goal is simpler. Turn selling time and acquisition spend into profitable client revenue at a rate that supports growth.
Sales efficiency ratio
Start with the sales efficiency ratio.
Sales efficiency ratio = revenue generated from new business / sales and marketing cost to win that business
This is the clearest top-line check on whether your sales motion makes financial sense. For an agency, it answers a hard question fast. Did the time, tools, fees, and labor used to win new work produce enough revenue to justify the effort?
On Upwork and similar platforms, this number gets distorted when sellers only count obvious cash spend. The actual cost base is wider:
- Proposal time
- Lead research time
- Paid tools
- Marketplace fees tied to acquisition
- Ads or outbound spend
- Non-billable sales labor
Leave out founder time or team selling time, and the ratio becomes a comfort metric instead of a decision metric.
Customer acquisition cost
The second metric is customer acquisition cost, or CAC.
CAC = total sales and marketing spend / number of new customers won
CAC tells you what one new client costs to acquire. In services, that number is often higher than expected because the expensive part is not software or ads. It is labor.
For a freelancer, CAC includes hours spent scanning job posts, writing custom proposals, following up, jumping on calls, and handling dead-end conversations. For an agency, it also includes sales team time, strategist input on proposals, and any account leadership involved before the deal is signed.
Small firms often misread performance. They treat unpaid selling time as overhead that does not count. It counts. If those hours could have been billed, used to improve delivery, or spent on higher-fit opportunities, they carry a real cost.
Customer lifetime value
The third metric is customer lifetime value, often shortened to CLV or LTV.
CLV = the revenue you expect from a client across the full relationship
CLV matters because a client is not just a signed contract. In a service business, value comes from retention, repeat work, expansion, and margin quality over time.
A useful way to think about CLV in services is to ask:
- How long does the average client stay?
- How often do they buy again?
- Do they expand into new retainers or projects?
- How much management overhead do they create?
That last question matters more than many agency owners admit. Two clients may generate the same revenue, but one creates constant revisions, scope friction, and account management drag. The higher-value client is the one that produces durable revenue without consuming disproportionate delivery energy.
Why these three belong together
Each metric answers a different business question.
- Sales efficiency ratio shows whether go-to-market spend is producing enough revenue.
- CAC shows what it really costs to win a client.
- CLV shows whether the client is worth winning.
Used together, they stop a common scaling mistake. Agencies increase proposal volume, hire sales help, or chase more platform leads before checking whether the clients they win pay back the acquisition cost fast enough. A higher close count does not fix weak economics.
If your sales activity is still spread across messages, spreadsheets, and scattered notes, clean that up first. A simple process for building a sales pipeline that your team can actually track makes these metrics easier to calculate and much harder to ignore.
Essential Supporting Metrics for Upwork Sellers
Core financial metrics tell you the outcome. Supporting metrics tell you what caused it.
For Upwork sellers, that distinction matters because the platform creates a fast feedback loop. If win rate slips, CAC usually rises. If time-to-close drags, cash flow gets uneven. If your pipeline coverage is weak, you start overreacting to every lead that appears.
Win rate
Win rate tracks how often your proposals or opportunities turn into signed work.
On Upwork, this can be measured in more than one way. A solo freelancer might track proposals sent versus contracts won. An agency may want a stricter version, such as qualified conversations versus deals closed. The exact formula matters less than consistency.
A low win rate usually points to one of four problems:
- Bad targeting. You're pursuing jobs that don't fit your offer.
- Weak positioning. Your profile, portfolio, or proof doesn't match the buyer's need.
- Generic proposals. The client can't tell why you're the right choice.
- Slow follow-up. You get interest, then lose momentum.
If win rate improves, acquisition cost often improves with it because you need fewer attempts to land the same amount of work.
Pipeline coverage
Pipeline coverage answers a simple question. Do you have enough active opportunity value to hit your revenue target?
A lot of freelancers skip this because they think pipeline coverage is only for large sales teams. That's a mistake. If your target for the month or quarter depends on one or two large deals landing, your business is fragile. Pipeline coverage forces you to look at deal concentration, not just optimism.
Strong coverage doesn't mean saying yes to every opportunity. It means building enough qualified volume that you can reject low-fit projects without panicking.
Time-to-close
Time-to-close measures the average time from first contact to signed agreement.
On Upwork, that timeline can be short. It can also stretch if the client has multiple stakeholders, unclear scope, or a slow internal decision process. Tracking time-to-close helps you separate deals that are moving from deals that are hanging around in your messages.
Practical rule: If a deal sits in your pipeline without a clear next step, it's usually costing more than it looks.
Shorter time-to-close often improves efficiency because less unpaid labor goes into each opportunity. But speed isn't the only goal. Fast deals that create scope confusion or poor-fit clients can damage CLV later.
What to watch every week
Instead of staring at a big dashboard, most Upwork sellers do better with a short weekly review:
- Count active qualified opportunities and compare them with your revenue goal.
- Review recent wins and losses to spot proposal patterns.
- Check aging deals that have stalled after a call or message exchange.
- Look at source quality so you know which job types bring better clients.
These are operating levers. They're closer to the work than CAC or CLV, which makes them more useful for weekly decisions. If your financial metrics are the scoreboard, these are the parts of the game you can adjust in real time.
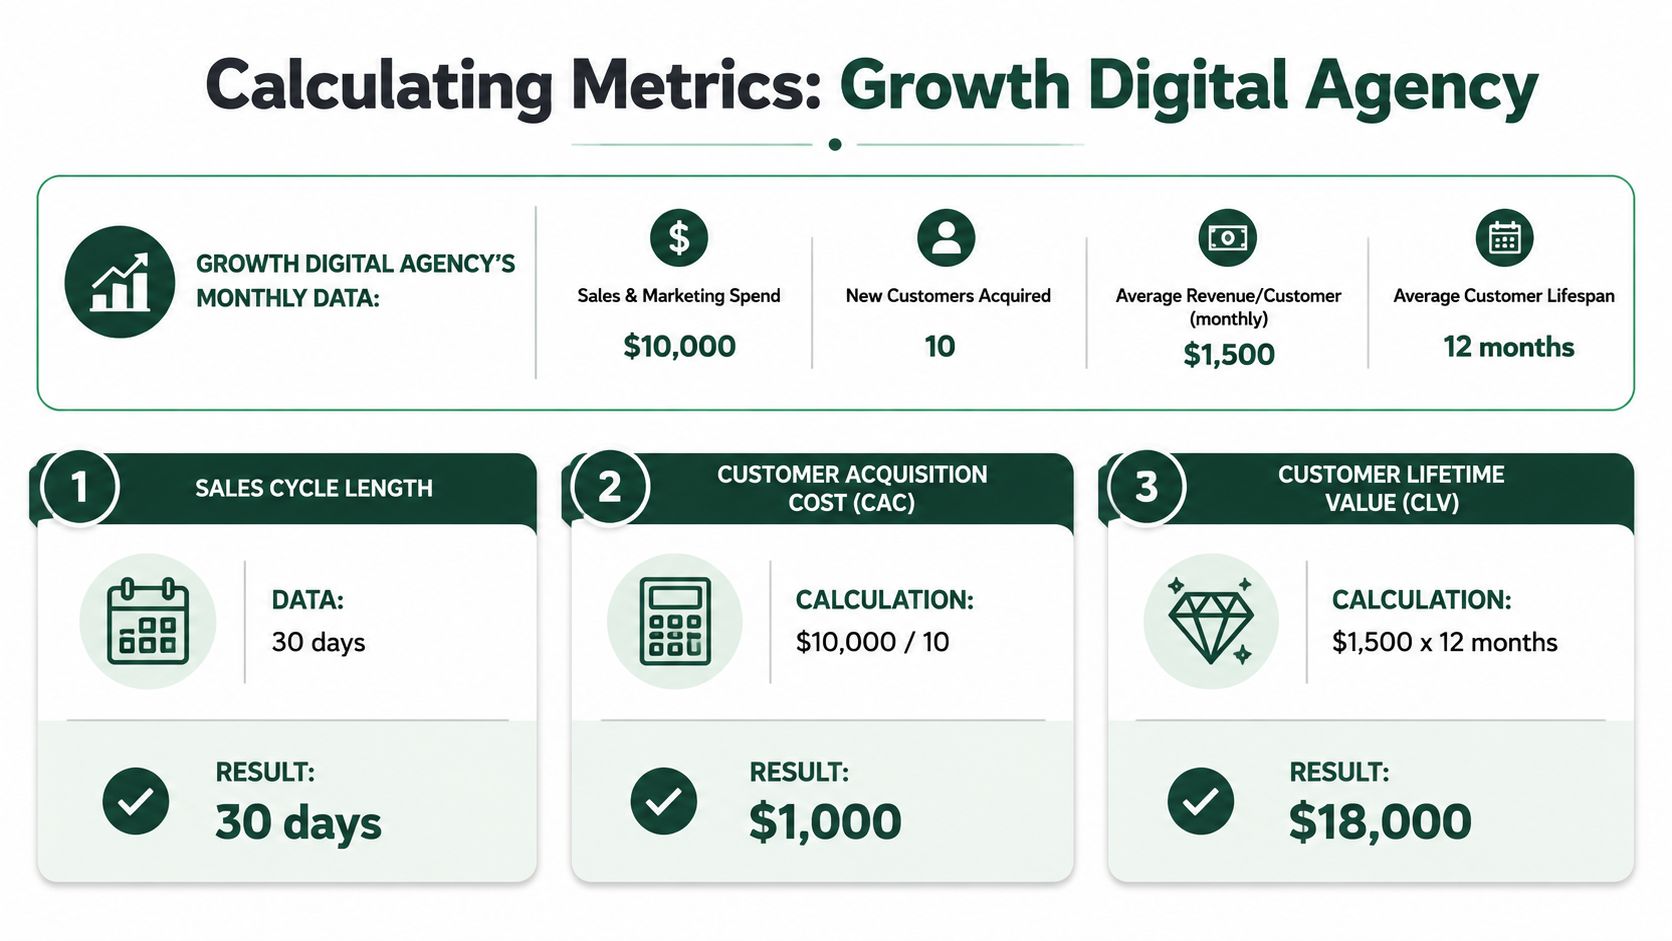
Calculating Your Metrics with Real World Examples
A busy month can still be an inefficient one.
An agency can send dozens of proposals, jump on discovery calls, win a few projects, and still come out with weak margins because too much unpaid effort went into each client. That is why calculation matters. If you cannot pull these numbers from your own records, you are still managing sales by feel.
Start with one period and one client cohort
Use a single time window first. For many agencies and freelancers on Upwork, one month is enough to spot patterns without waiting a full quarter.
Pull five inputs from that period:
- Total sales and marketing cost
- Number of new clients won
- Revenue from those new clients
- Average client value over the relationship
- Average days from first qualified contact to signed agreement
Keep the cohort clean. If you mix revenue from long-term clients with clients acquired this month, CAC and sales efficiency both get distorted. For Upwork sellers, this matters even more because repeat work and fresh wins often sit in the same account history.
Calculate CAC first
CAC forces cost visibility. Many small agencies understate it because they count software fees and ad spend, but ignore founder time, proposal writing, follow-up, and pre-sales calls.
CAC formula
Total sales and marketing spend / number of new customers acquired
Example:
- Sales and marketing spend for the month: $4,000
- New clients won: 4
CAC = $4,000 / 4 = $1,000
That means it cost $1,000 to acquire each new client.
For an Upwork-first agency, include platform fees tied to acquisition, connects, paid availability boosts if you use them, lead research time, CRM cost, and the labor behind proposals. If your numbers still live across email, spreadsheets, and DMs, a setup built around a CRM for agencies makes these calculations much easier to maintain.
Calculate sales efficiency ratio next
After CAC, measure output against spend.
Sales efficiency ratio formula
Revenue generated from new business / sales and marketing spend
Example:
- New revenue from the same 4 clients: $12,000
- Sales and marketing spend: $4,000
Sales efficiency ratio = $12,000 / $4,000 = 3.0
In plain English, each $1 spent on sales and marketing produced $3 in new revenue.
That looks strong on paper. It may still hide a problem. If those projects are low-margin, one-off builds with heavy revision cycles, the ratio can flatter a weak offer. Service businesses need to read this metric alongside delivery reality, not in isolation.
Here's a walkthrough to make the process easier to picture:
Estimate CLV without pretending precision
Small agencies often skip CLV because they assume it requires perfect retention data. It does not. It requires an honest estimate based on actual buying patterns.
CLV formula
Average client revenue across the relationship
Two simple ways to calculate it:
- Project work: initial project value plus average follow-on work from similar clients
- Retainers: average monthly revenue multiplied by average retention length
Example for a project-based Upwork seller:
- Average initial project: $3,000
- Average follow-on work within 6 months: $2,000
Estimated CLV = $5,000
Example for a retainer agency:
- Average monthly retainer: $2,000
- Average retention: 6 months
Estimated CLV = $12,000
Segment this by offer type if needed. A branding project, paid media retainer, and SEO audit should not share one blended CLV if their expansion paths are different.
Add time-to-close
Now measure how long it takes to convert work you are already pursuing.
Example:
- Deal 1 closed in 5 days
- Deal 2 closed in 12 days
- Deal 3 closed in 8 days
- Deal 4 closed in 15 days
Average time-to-close = 10 days
That number matters because long cycles increase hidden acquisition cost. More messages, more calls, more revisions to the scope, more calendar drag. On Upwork, shorter cycles are common, but slow decisions still show up around larger contracts, team-based approvals, and poorly defined briefs.
Put the four metrics together and the trade-offs become visible.
A service can have low CAC but weak CLV. Another can have a strong sales efficiency ratio but long close times that eat founder capacity. A third can close fast on Upwork and still be a bad bet because repeat work never materializes. When you look at all four together, you start seeing the complete story.
Benchmarking Performance and Setting Smart Goals
Once you have your numbers, the next question is obvious. Are they good?
For most agencies, external benchmarks are useful only as rough context. They can help you avoid operating in the dark, but they shouldn't replace internal comparison. Your business model, price point, fulfillment method, and client quality all shape what “good” looks like.
Use benchmarks carefully
A foundational SaaS benchmark is the Magic Number, often defined as new ARR generated this quarter multiplied by 4, divided by last quarter's sales and marketing spend. A value above 1.0 is usually interpreted as strong efficiency, and gross sales efficiency ratios between 1 and 3 are often treated as a broadly healthy range, based on HeyIris's overview of sales efficiency benchmarks.
That benchmark came from subscription software, not agency services. Still, the underlying lesson is useful. Strong growth is not enough by itself. The cost of producing that growth matters.
For agencies, I treat external benchmarks as a reference point, not a target to copy. The more useful question is whether your own efficiency is improving over time.
Build your own baseline
Take one recent period and lock in a baseline for:
- CAC
- Sales efficiency ratio
- Win rate
- Time-to-close
- Client value by offer type
That baseline becomes the standard for the next review. If CAC falls while client quality holds, that's progress. If time-to-close shortens but churn rises, that's not progress. If win rate improves only because you're bidding on smaller, easier projects, check whether overall revenue quality improved.
Good benchmarking compares present performance to past performance under similar conditions.
Set goals that change behavior
Smart goals for sales efficiency are operational, not motivational. They should tell you what to do differently.
Examples of useful agency goals include:
- Reduce wasted proposal effort by cutting low-fit job submissions.
- Shorten stalled deal time by requiring a defined next step after every discovery call.
- Improve client value by focusing outreach on service lines with stronger expansion potential.
- Protect margin by refusing deals that demand heavy pre-sale labor without real buying intent.
The point isn't to produce impressive dashboards. It's to create a feedback loop. Track the number, inspect what changed it, then adjust process. That's how sales efficiency metrics become a growth system instead of a reporting ritual.
Practical Steps to Improve Your Sales Efficiency
Most efficiency problems come from one of three places. You're targeting the wrong work, spending too much manual effort per opportunity, or winning clients that never become valuable accounts.
The fix is rarely “work harder.” It's usually process design.
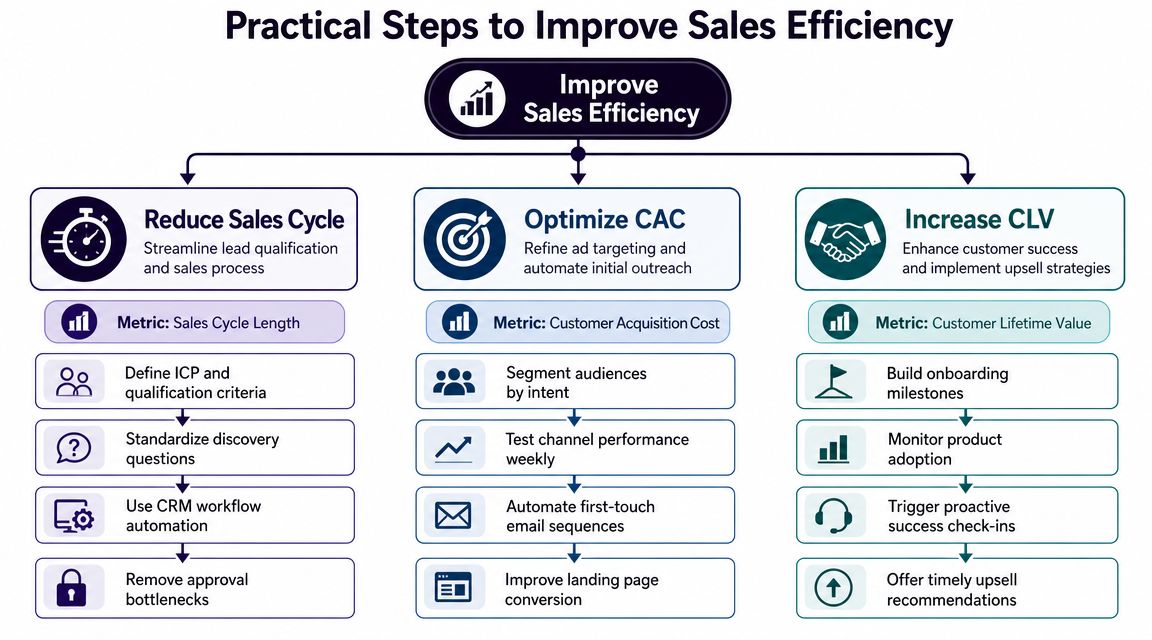
Reduce wasted selling time
If CAC is too high, start by auditing where unpaid selling time goes. In agencies, the biggest leaks are often repetitive lead research, custom proposal writing for poor-fit jobs, and follow-up that depends on memory.
A better approach looks like this:
- Tighten qualification first. Reject weak-fit projects earlier instead of trying to rescue them with clever proposals.
- Use reusable proposal structure. Keep the diagnosis and proof specific, but don't rebuild the whole document every time.
- Standardize follow-up. Every qualified conversation should trigger a next action, not a vague reminder.
- Track no-decision losses. They often reveal process issues more than pricing issues.
Improve speed where speed matters
On Upwork, response timing affects visibility and momentum. Faster isn't always better, but late is usually worse.
That's where automation can improve efficiency if you use it selectively. Tools like CRMs, scheduling systems, proposal templates, and automated message workflows reduce manual load. For marketplace sellers, sales automation can handle repetitive top-of-funnel tasks so human effort stays focused on qualification, calls, and closing.
One example is Earlybird AI, which connects to an Upwork account, learns project preferences from feedback, searches for jobs, crafts personalized proposals, and replies to client messages automatically. In practice, that kind of setup is less about “doing more outreach” and more about reducing the labor cost of timely, consistent outreach.
Raise client value, not just close rate
A lot of sellers improve short-term conversion and accidentally harm the business. They chase easier-to-win projects, underprice the first engagement, or say yes to clients who create endless delivery friction.
That's why CLV has to stay in the conversation.
Ways to improve client value include:
- Sell clearer scope so the first project creates trust instead of cleanup.
- Design an expansion path from one-off work into retainer, maintenance, or strategy support.
- Filter for buyer quality. Clients who value process usually create better long-term economics than clients who only compare hourly rates.
- Hand off well after close. Weak onboarding can ruin a good acquisition.
Better sales efficiency doesn't mean squeezing the sales function harder. It means removing work that doesn't create durable revenue.
When agencies improve efficiency the right way, they don't just close more. They spend less effort per win, make delivery easier to support, and create more room for profitable growth.
Common Pitfalls and the Future of Sales Efficiency
The biggest mistake with sales efficiency metrics is treating one number like the whole story.
An agency lowers CAC and thinks the system improved. Then the new clients turn out to be price-sensitive, slow to approve work, and unlikely to renew. Another team shortens time-to-close by pushing harder in discovery, but the deals arrive with fuzzy scope and create delivery headaches. The metric improved. The business didn't.
Where agencies misread the data
A few pitfalls show up repeatedly:
- Undercounting sales cost. Founder time, proposal labor, and tool spend often get ignored.
- Optimizing for cheap wins. Lower acquisition cost means little if long-term client value falls.
- Ignoring retention dynamics. Front-end revenue can look efficient while back-end churn weakens the model.
- Comparing unlike periods. Seasonal demand, offer changes, or staffing shifts can distort conclusions.
The fix is to read metrics as a system. CAC, conversion, cycle time, and client value should be interpreted together.
What changes in AI-assisted selling
There's also a newer issue that most standard definitions don't solve well. A major underserved angle in sales efficiency is whether these metrics still mean the same thing in AI-assisted go-to-market motions. As Upcell's discussion of modern sales efficiency metrics notes, the practical question is what counts as “sales spend” when AI compresses prospecting and proposal writing into minutes. Is the cost headcount, software, model usage, or a blended operating cost?
That question matters for agencies on Upwork because automation changes the shape of labor. If software handles job discovery, proposal drafting, and rapid follow-up, your process gets faster. But faster alone doesn't prove better. You still need to know whether the clients are profitable, whether the close quality holds up, and whether retention stays healthy.
That's where sales efficiency metrics still earn their place. Not as static formulas, but as a way to judge whether automation is creating real business value or just more motion at lower effort.
If you want a more efficient Upwork sales process, Earlybird AI is built for that use case. It automates job discovery, proposal drafting, and client replies while giving agencies and freelancers a clearer view of outreach performance, so you can spend less time on repetitive sales work and more time on qualified conversations and delivery.


