
← Back To Blog
Upwork Data Analytics: Turn Numbers Into Wins
You know the feeling. You've got a dozen proposals out, a profile that looks solid on paper, and the Upwork dashboard open in another tab while you wonder why the next client still hasn't replied. Most freelancers treat those numbers like background noise, then keep tweaking copy and hoping the market responds.
That's the wrong mental model. Upwork data analytics is the operating system behind the whole selling process, because the platform already gives you a live read on where attention is coming from, where it drops off, and where revenue starts to stick. If you read those signals like an operator, not a spectator, the dashboard stops being decoration and starts telling you what to fix next.
The Moment the Dashboard Stops Being Decoration
The bad habit is easy to recognize. A freelancer logs in, checks a few proposal statuses, maybe notices a profile view count, then goes back to job feeds as if the numbers were just a receipt for work already done. That loop feels productive, but it leaves the core question unanswered, which is why one proposal gets seen and another disappears into the feed.
The moment the dashboard becomes useful is the moment you stop asking, “How am I doing?” and start asking, “Where is the funnel breaking?” Upwork's own Stats and trends system is built for that kind of diagnosis. After a freelancer's first proposal submission or direct hire, it starts populating, updates in about 24 hours, and breaks proposal performance into Sent, Viewed, Interviews, and Hires, so you can see where a client journey stalls (Upwork stats and trends guidance).
A live feedback loop, not a monthly report
That matters because marketplace selling is never just about “more effort.” A profile change can raise views. A tighter proposal can improve interviews. Better targeting can cut waste before you spend Connects. If you only look at the dashboard once a week, you are reading yesterday's weather while the market keeps changing.
Practical rule: treat every click, view, and reply as a decision signal. If a metric moves, something in your positioning, targeting, or follow-up moved with it.
Upwork's marketplace is large enough that small gains compound quickly. Backlinko reported about 794,000 active clients in Q3 2025, with clients spending roughly $4 billion annually on the platform, so a tiny lift in visibility or reply rate can matter across a huge buyer base (Upwork marketplace size data). That is why the dashboard is not a reporting chore. It is the fastest way to see whether your next change is helping or hurting.
What Upwork Data Analytics Actually Means
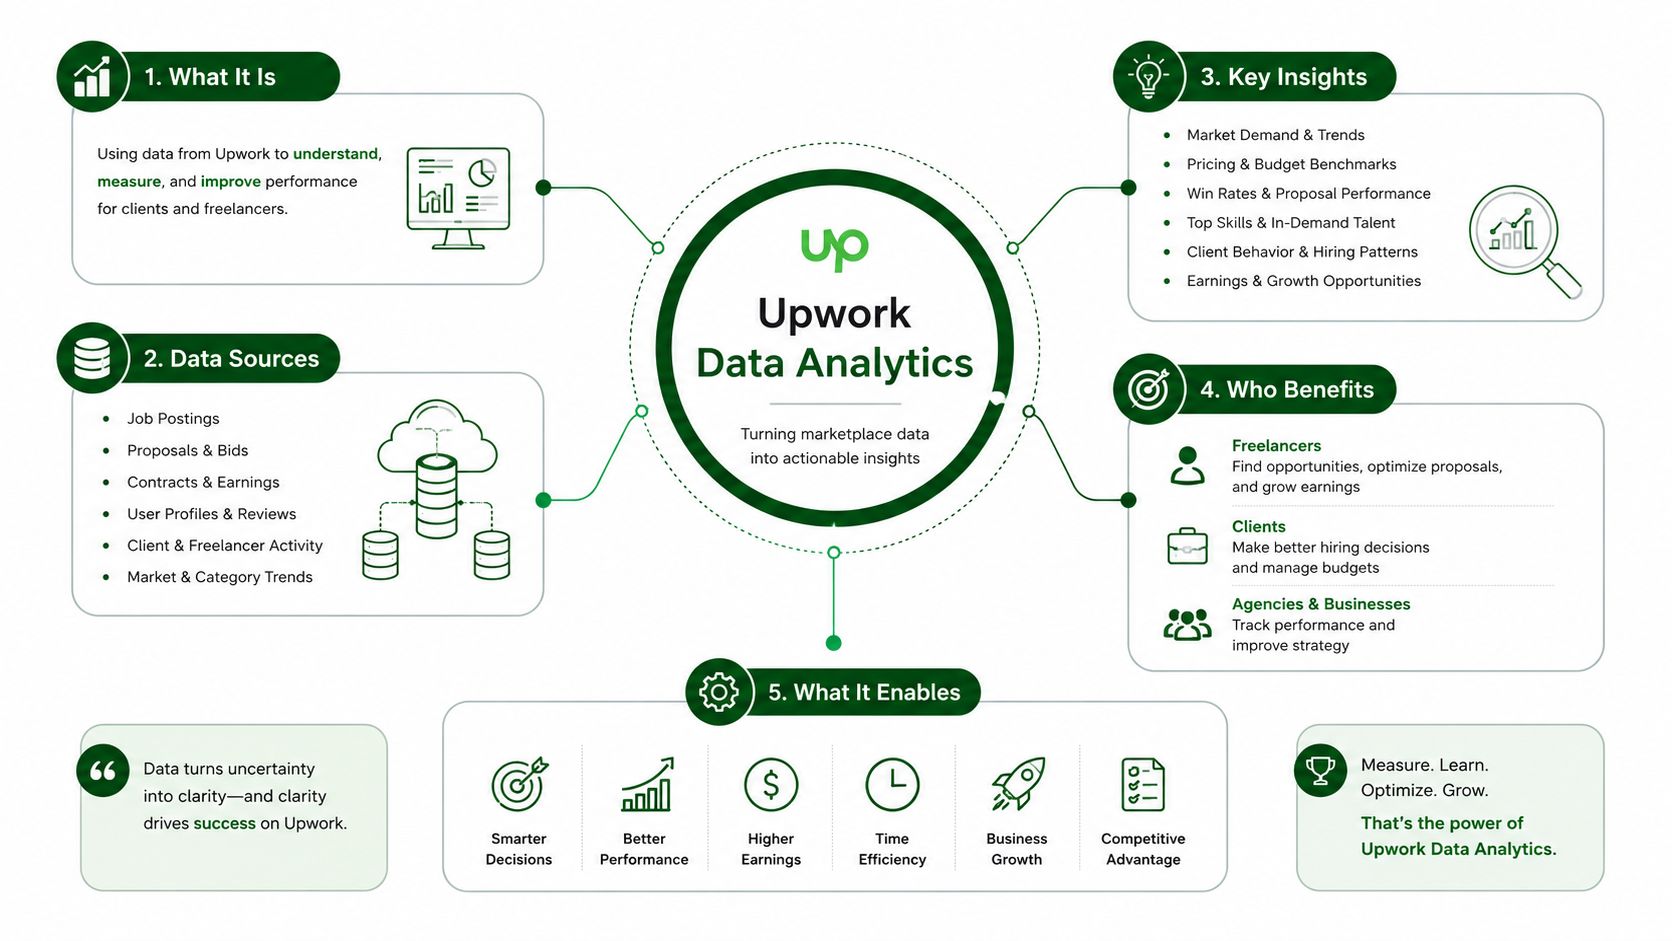
Upwork data analytics is the practice of turning the platform's marketplace signals into decisions. Those signals include earnings, profile views, proposal views, responses, impressions, clicks, invitations, and badge status, and they show up in Upwork's reporting areas once your account has enough activity to surface them. The point is not to admire the numbers. It is to map each one to a business choice.
Read the funnel, not just the totals
A profile view tells you someone noticed your presence. A proposal view tells you the client opened your bid. A response tells you the message crossed the line from passive browsing to active consideration. The same dashboard can answer very different questions depending on where the number moves.
If profile views are low, the issue is usually discoverability. If profile views are fine but proposal views are weak, the job targeting or niche fit is off. If proposals are viewed but interviews do not follow, the problem is usually in the proposal itself, the offer framing, or the trust signal you are sending. That is a much sharper way to work than sending more proposals and hoping volume fixes the gap.
Built-in analytics versus service analytics
There is also a second meaning of the phrase. Upwork data analytics can describe the work sellers do for clients, not just the work they do on the platform. Upwork's own data-analyst guidance describes work that can span SQL-based extraction, dashboarding in Tableau or Power BI, KPI definition, machine-learning forecasting, A/B testing, and data-quality controls, which shows how broad the service category is (Upwork data analyst guidance).
That distinction matters because a freelancer selling analytics services is judged on two layers at once. First, how well they read the marketplace signals. Second, how well they can explain raw-source ingestion, validation, and decision dashboards in a reproducible workflow. The strongest Upwork sellers in this category do not separate those things. They use their own marketplace data to improve the way they sell the exact skill they are offering.
What the platform is really measuring
Upwork's My Stats area covers earnings, proposal success, contracts, client feedback, and job success rate, which act as the platform's built-in signals for whether proposals and client work are turning into durable revenue (Upwork My Stats guidance). If you are serious about this market, those are not vanity numbers. They are the operating history of your business.
For a practical way to connect those signals to real follow-through, the client engagement metrics framework helps separate activity from revenue. A profile can look busy while reply quality stays weak, and that gap is where analytics earns its keep.
Learning which metric deserves your attention first is the key work. That depends on whether you are trying to get discovered, get replies, or keep clients long enough for the economics to improve.
The Metrics and Dashboards That Matter
Some numbers deserve a daily glance, others only matter when you're reviewing a pattern, and a few should only come out during a monthly or quarterly audit. The mistake most sellers make is treating all metrics as equal, then optimizing the easiest one to watch instead of the one that pays. Upwork's My Stats area gives you enough signal to avoid that trap if you read it with discipline (Upwork My Stats guidance).
What to watch every day
For a solo seller, the fastest loop is usually proposal views, responses, and earnings. Those three tell you whether your positioning is getting attention, whether your pitch is resonating, and whether the attention is turning into money. For an agency, the same data matters, but it needs to be separated by bidder or account so you can tell whether the issue sits with the person sending the proposal or the market segment they're chasing.
Contract history and client feedback deserve more patience. They're lagging signals, which means they reflect the quality of work and fit after the sale, not the pitch before it. Job success rate belongs in the same bucket. It's a durable signal, but it's not the thing to obsess over every morning.
Upwork's metrics work best when you use them as a chain, not as isolated trophies. One strong number doesn't mean the funnel is healthy if the next stage is empty.
Why repeat-client economics change the meaning of earnings
Upwork's fee structure drops as a client relationship matures. The platform takes 20% on the first $500 billed with a client, 10% on billings from $500.01 to $10,000, and 5% on billings above $10,000 (Upwork fee structure). That means early revenue is more expensive than later revenue, so the first project and the fifth project should never be evaluated the same way.
Many sellers often misread their charts. A new client who buys a small test project can look less attractive than a repeat client at first glance, yet the economics improve as the relationship matures. If you're an agency, that curve also changes how you should score lead sources. A lower initial close rate can still be profitable if it produces a sticky client base.
One external lens can sharpen the internal view
The best operators connect dashboard reading with client-retention thinking, not just acquisition. That's why it helps to pair Upwork metrics with a practical framework like client engagement metrics, especially when you're deciding which leads deserve follow-up versus which ones are just noise.
For solo sellers, I'd pin proposal views, responses, and job success rate to the home screen. For agencies, I'd add bidder-level contract history and client feedback, because the same marketplace can hide very different performance by person, niche, and account. The dashboard only becomes useful when it tells you what to change next, not when it merely confirms that you were busy.
From Numbers to Action on Profile and Bidding
A client can arrive with plenty of profile views and still never start a conversation. That usually means the profile attracts attention but does not create enough confidence to justify a reply. If views are thin, the problem is farther upstream, in the title, overview, or portfolio. If views are healthy but interviews stay weak, the offer and the job post are probably not aligned closely enough to make the client take the next step.
Diagnose the bottleneck before you rewrite everything
Start with the simplest interpretation.
- Low profile views: your title, overview, or portfolio is not pulling in the right traffic.
- Good profile views, weak proposal views: you are probably bidding on jobs that do not match how clients read your profile.
- Good proposal views, weak interviews: the proposal is not creating enough confidence, clarity, or urgency.
That sequence sounds basic, but it prevents a lot of wasted motion. Many freelancers rebuild everything at once, then cannot tell what improved. A cleaner approach is to change one layer at a time, give the market time to react, and keep only the adjustment that moves the metric you care about.
The most useful shift is usually small. Tighten the headline so it matches the work you want, trim the portfolio so it supports that promise, and make the first paragraph of the proposal answer the client's immediate concern.
Turn bidding into a measured filter
Bidding gets sharper once every job post stops looking interchangeable. Some clients respond to a fast, direct proposal. Others need a more careful follow-up because they are comparing several similar profiles. The only reliable way to separate those cases is to review your own response patterns over time, then compare them by category, project type, and client behavior.
Proposal discipline matters more than volume. If a certain type of job repeatedly gets views but no response, your history is already telling you to stop paying for the same mismatch. If another job type converts better, it deserves more of your time and Connects budget. The goal is not to chase every opening. It is to learn which openings pay back.
Do not optimize for how busy the pipeline feels. Optimize for which job types actually turn into conversations.
Upwork's own data analyst guidance points out that clear scope, timeline, and budget reduce mismatch and improve proposal quality. That matches what I have seen in agency funnels. A vague post often turns your analytics into a record of confusion, not performance.
Use the platform before adding complexity
Native analytics can already show a lot about where the funnel leaks, so there is no reason to overbuild on day one. If you want a structured way to think about proposal performance and follow-up flow, the internal framework in job success score analysis is a useful companion to the dashboard itself.
For agency teams, the job success score is also a useful check on whether one seller is carrying a weak close rate that another teammate is masking with stronger retention. That matters because the account can look healthy while one bidder's activity drags on future opportunities. I have found that the quickest wins usually come from one of three changes: tightening profile language, changing bid selection, or fixing the first sentence of the proposal. Each one changes a different part of the funnel.
The practical habit is simple. Review the pattern, adjust the profile or bid, and watch the next update cycle for movement. That rhythm turns the dashboard into an operating system instead of a retrospective.
Tools and Integrations That Extend the Funnel
Native Upwork stats are the starting line, not the whole race. Once a freelancer or agency starts handling more volume, spreadsheet tracking, BI dashboards, CRM-style follow-up notes, and automation surfaces start filling in the gaps that the marketplace view doesn't show. The right stack makes the funnel continuous instead of fragmented.
What each layer should answer
Upwork's own dashboard answers what happened on the platform. A spreadsheet answers what happened over time across multiple bids or accounts. A BI layer helps expose trends by client type, bidder, niche, or source. A CRM-style workflow answers who needs follow-up, when they need it, and what happened after the initial contact.
That distinction matters because it keeps you from paying twice for the same data. If your automation tool only mirrors what Upwork already shows, it's just another screen. If it adds proposal velocity, reply patterns, and follow-up history, it starts to become operational infrastructure.
For teams that want a structured way to manage that pipeline, the workflow ideas in Upwork CRM tool fit naturally into a multi-user setup. That's especially useful when different people handle prospecting, proposal writing, and client messaging.
Where automation starts to matter
Automation platforms can surface the parts of the funnel that native stats don't make obvious, especially when proposal volume is high and manual tracking breaks down. Earlybird AI is one example of that kind of layer. It connects to an Upwork account, uses feedback to learn ideal projects, and adds analytics, profile optimization, and multi-user workflows for agencies. That makes it a workflow layer on top of marketplace stats, not a replacement for them.
The practical value is in the feedback loop. Once proposal timing, reply rates, and follow-up behavior are visible together, you can compare what happens when you batch by client type instead of by instinct, or when you change proposal sequencing instead of just rewriting copy. That kind of instrumentation is what turns “we send a lot of bids” into a measurable system.
For teams wanting a broader operating model for automation, optimizing developer AI workflows is a helpful external read because it frames automation as process design, not just task replacement.
Benchmarks need outside data
Upwork's own stats won't tell you whether your reply rate is good in context. Independent marketplace data from 133,872 outbound proposals showed a platform-mean agency reply rate of 7.45% in late 2025 through early 2026, which makes reply-rate benchmarking a measurable target instead of a guess. That's the kind of external benchmark that turns internal dashboards into something you can compare against.
In practice, the stack works best when each layer has one job. Upwork tells you what the marketplace did. Your tooling tells you how your process behaved. Together, they show whether the problem is the profile, the bid, the follow-up, or the system around them.
Two Short Case Snapshots
The fastest way to make analytics feel real is to see how it changes decisions. Numbers don't fix anything by themselves. People do, once the numbers stop being vague and start pointing at a bottleneck.
A solo analyst tightens the niche
A solo data analyst on Upwork had plenty of activity but weak interview flow. Her profile views were decent enough, but the ratio from views to interviews was low, which told her the problem wasn't invisibility. It was fit.
She narrowed the profile around one client problem she solved especially well, then rewrote the overview and project examples to match the jobs she wanted. After that, she stopped applying broadly and focused on roles that matched the niche more closely. The result was a cleaner funnel, fewer irrelevant bids, and more interview invites within a quarter because the dashboard stopped leaking attention into the wrong market.
A three-person agency changes proposal rhythm
A small analytics agency had the opposite problem. They were sending enough proposals, but reply behavior looked inconsistent across the team. Once they layered external tracking on top of Upwork stats, they noticed that batching proposals by client type produced steadier response patterns than grouping by hour of day.
That insight changed how they worked. The agency no longer measured success by raw proposal count alone. They used their analytics stack to separate what the marketplace saw from what the team controlled, then adjusted proposal sequencing and follow-up accordingly. The visible improvement wasn't magic, it was cleaner process design backed by better tracking.
These are different businesses, but the lesson is the same. The metric only matters if it points to a decision. Once it does, the fix tends to be less dramatic than people expect, but much more durable.
Compliance, Guardrails, and the Honest Limits of Analytics
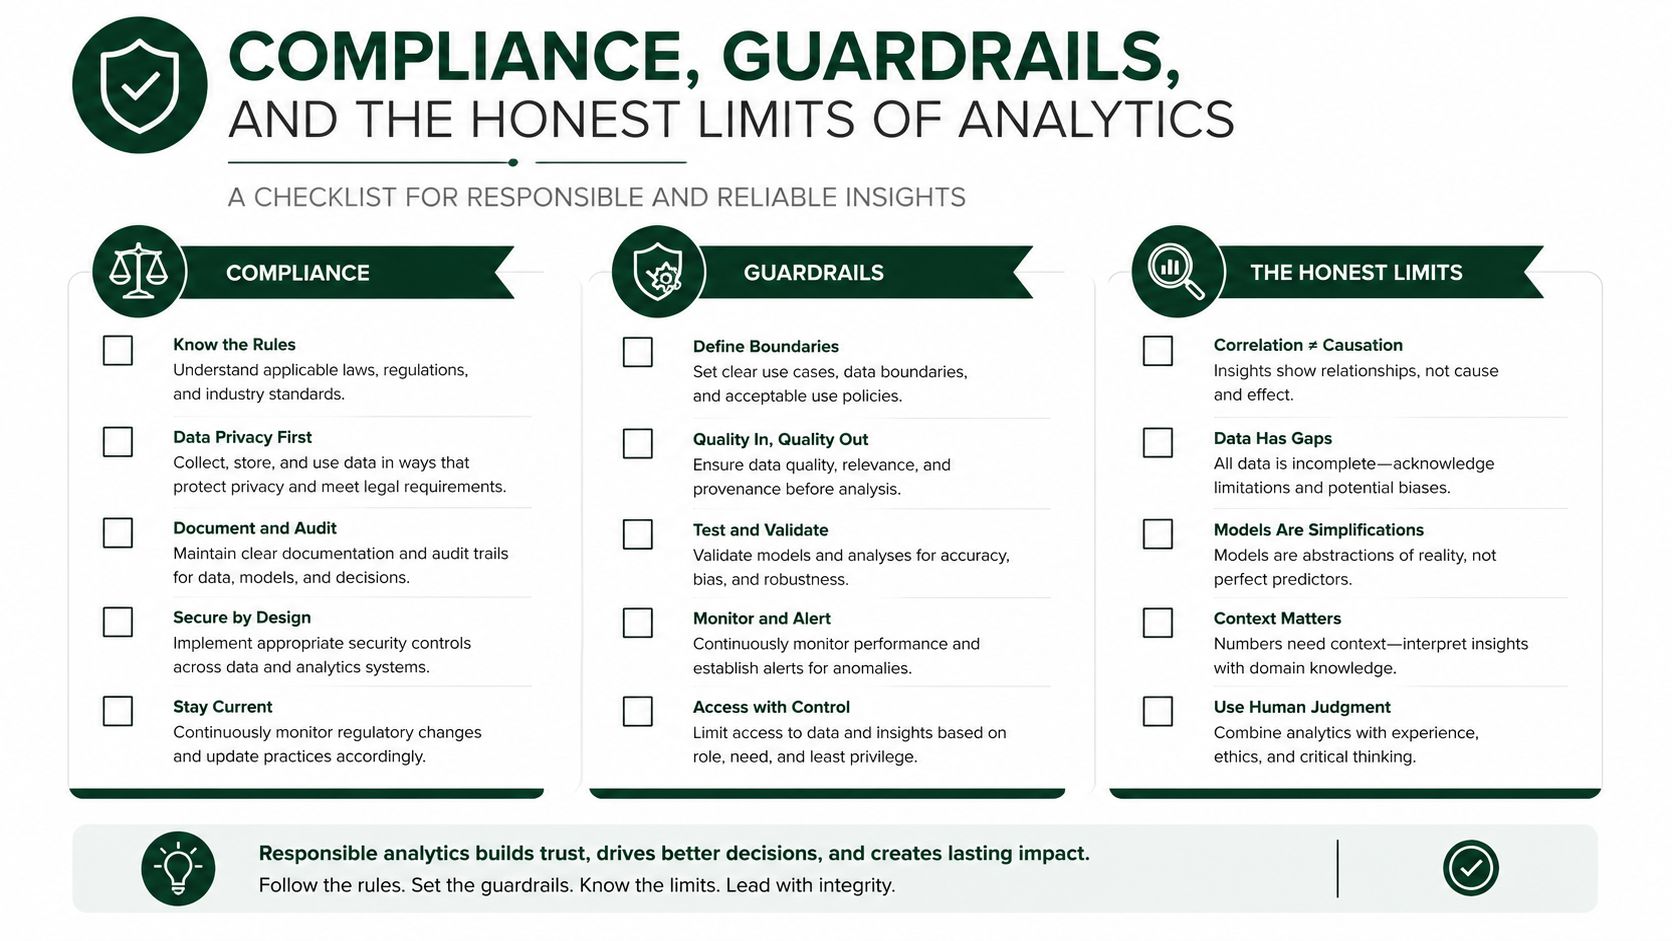
Dashboards don't override platform rules, and they definitely don't justify sloppy data handling. Upwork's guidance for analytics and security in freelance work emphasizes a risk-tiered access model, periodic re-evaluation of permissions, minimizing local copies of sensitive data, and logging what talent accesses, because tighter access controls reduce compromise risk when freelancers touch PII or other sensitive data (Upwork analytics and security guidance).
Guardrails that keep analytics defensible
The first rule is simple, least privilege. If a contractor doesn't need access to a dataset, don't give it to them. The second is logging. If someone touches client data, you should know what they accessed and why. The third is restraint. Don't keep extra local copies around just because it's convenient.
Those habits matter even more on agency accounts where several people may touch the same opportunities, messages, or client files. A clean workflow protects both performance and trust. It also helps when you're asked to explain how data moved through the process.
For anyone working near scraping, enrichment, or external collection, it's also smart to keep a close eye on the practical boundaries discussed in legal principles for web scraping. The point isn't to avoid automation. It's to make sure your process respects both platform rules and client obligations.
What not to optimize
The biggest mistake is using analytics to justify bad behavior. Don't flood the platform with low-quality proposals just because volume seems easier to measure. Don't lean on automation outputs the platform disallows. And don't assume that a higher response count means the pipeline is healthy if the work quality or account health is slipping elsewhere.
Analytics should make you more precise, not more reckless. The best Upwork operators use the dashboard to narrow uncertainty, improve fit, and protect the account they depend on. If the numbers point you toward shortcuts that break trust, they're telling you to stop, not speed up.
If you want a cleaner way to turn Upwork metrics into daily sales action, visit Earlybird AI and see how its analytics, profile optimization, and multi-user workflows fit into an Upwork selling system. It's built for freelancers and agencies that want to read the funnel, respond faster, and keep their process organized without losing sight of account safety.