
← Back To Blog
Lead Generation Rate: Benchmarks and Growth Tactics
A B2B team that answers an inbound lead within five minutes can convert at roughly 21%, while a team that waits a day or longer may convert only about 2.3%, creating an approximately 9x gap on the same lead pool (Aloware's lead response benchmarks). That changes how agency owners should think about lead generation rate. More traffic can help, but traffic alone won't repair a funnel that qualifies slowly, routes poorly, or leaves interested buyers waiting.
Lead generation rate is best treated as an operating metric, not a vanity number. It tells you how efficiently attention becomes a lead, how reliably a lead becomes sales-qualified, and how much friction appears before an opportunity reaches revenue. The useful question isn't "What is a good rate?" It's, "Which stage is losing momentum, and what happens immediately after intent appears?"
What 2026 Data Shows About Lead Generation Rates
The 2026 benchmark picture challenges teams that still judge growth through sessions, impressions, and raw form fills. A recent benchmark found that the median B2B website conversion rate fell to 2.9% across 14 industries and more than 100 million data points (Callbox's B2B lead generation statistics). Its channel medians were 2.6% for organic search, 2.4% for email, 1.5% for paid search, and 0.9% for paid social.
Those figures describe capture performance, not the health of the entire pipeline. A campaign can attract a suitable audience, then lose prospects through a complex form. A landing page can convert adequately while sales delays first contact. A channel can generate inexpensive leads that rarely become qualified conversations.
A broader analysis across 13 industries, more than 110 million tracked sessions, and over £33.8 million in tracked spend recorded an average B2B lead conversion rate of 5.13% in 2026. It also reported a 1.7% form conversion rate and a 1.2% call conversion rate (Piperocket's lead generation statistics research). The distinction matters because roughly 40% of B2B conversions happened by phone rather than form submission in that dataset. Counting forms alone can therefore understate demand and misdirect optimization.
Why volume masks operational friction
When pipeline slows, agencies often increase advertising, publish more content, or purchase additional prospecting data. These actions can raise activity while leaving throughput unchanged. If the team cannot identify, qualify, and respond to demand quickly, added volume creates a larger queue of aging leads.
The operating requirement is straightforward: connect capture with immediate ownership. Each meaningful inquiry needs a defined destination, a qualification rule, and a response service level. Automation can assign, enrich, and trigger an initial response while the responsible rep prepares the human follow-up. Teams comparing tools can review top lead generation platforms 2026, but software will not fix unclear definitions or broken handoffs.
Practical rule: Treat every lead generation rate as a diagnostic signal. Locate the stage, handoff, or response delay behind it before changing the channel mix.
Calculating Metrics Across the Funnel Stages
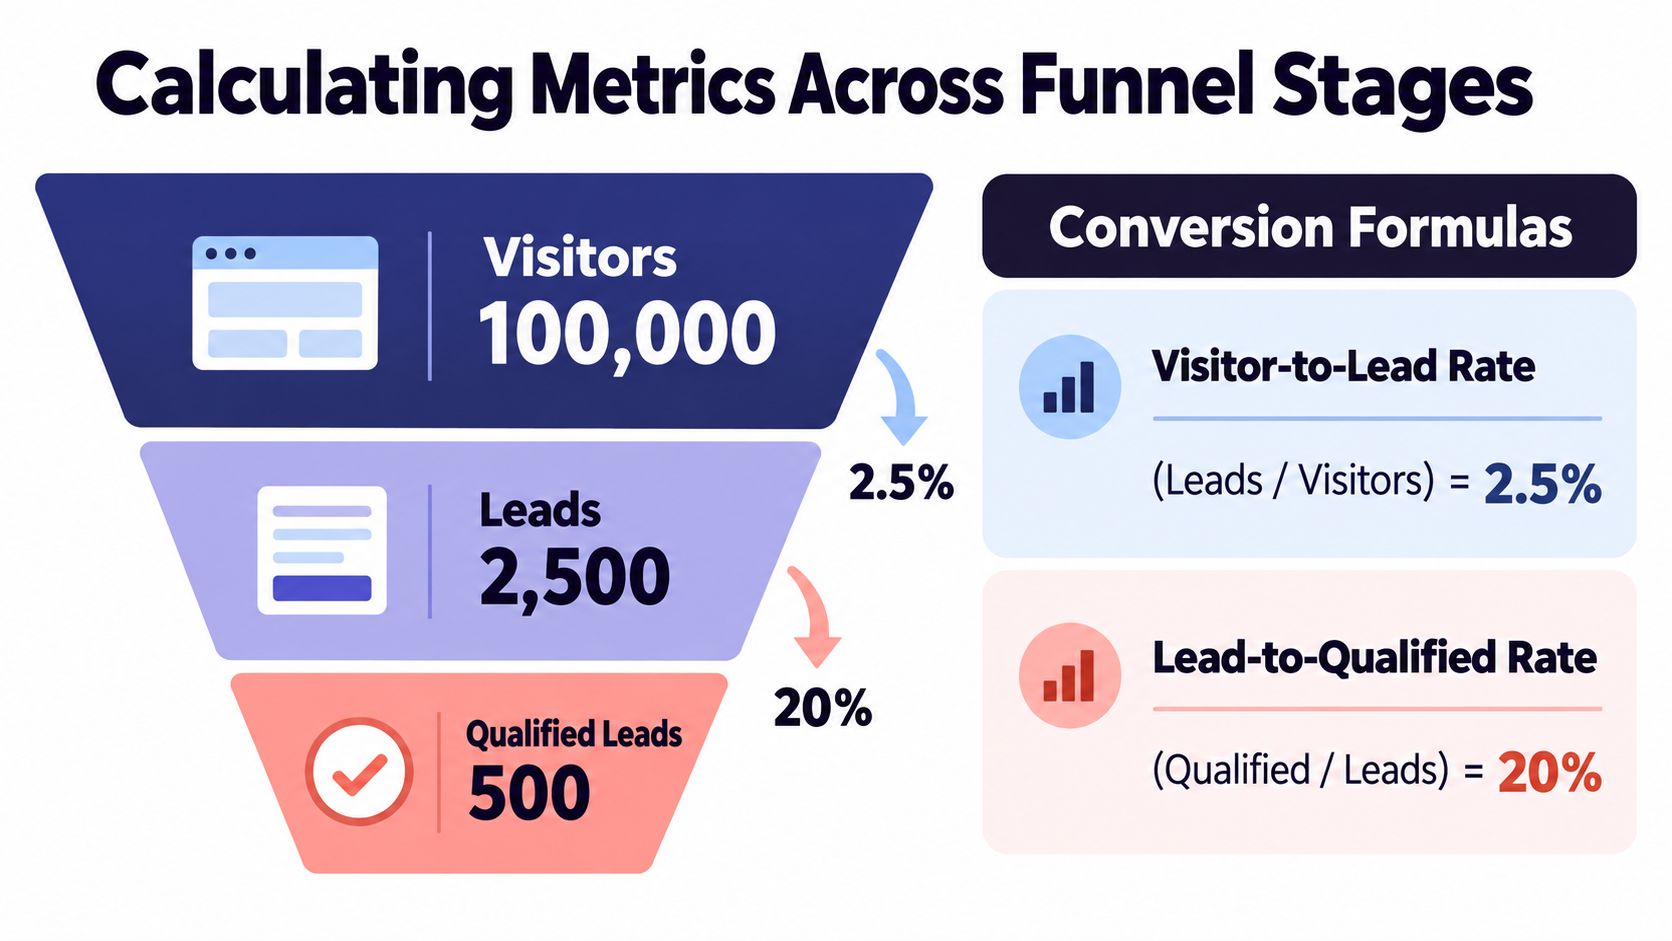
A universal benchmark is misleading because “lead generation rate” can describe several different transitions. Visitor-to-lead measures capture efficiency. Lead-to-MQL measures fit or intent against your marketing definition. MQL-to-SQL measures whether sales accepts the handoff. Opportunity-to-close measures commercial execution.
Start with the denominator
Use a consistent cohort and period. Don't compare monthly leads with quarterly opportunities, or count repeated form submissions as separate people while counting one opportunity only once. Decide whether your organization reports unique contacts, companies, inquiries, or buying groups, then keep that definition stable.
The basic formulas are straightforward:
- Visitor-to-lead rate: leads divided by visitors, multiplied by 100.
- Lead-to-MQL rate: MQLs divided by leads, multiplied by 100.
- MQL-to-SQL rate: SQLs divided by MQLs, multiplied by 100.
- SQL-to-opportunity rate: opportunities divided by SQLs, multiplied by 100.
- Opportunity-to-close rate: closed-won deals divided by opportunities, multiplied by 100.
Suppose a site receives 10,000 visitors and generates 250 leads. The visitor-to-lead rate is 2.5%. If 50 of those leads meet the MQL definition, the lead-to-MQL rate is 20%. Those calculations are illustrative, not a benchmark. Their value comes from showing where the funnel changes shape.
Diagnose the leak, not the headline
Across B2B pipeline benchmarks, lead-to-MQL conversion commonly sits around 20% to 25%, MQL-to-SQL around 12% to 18%, and SQL-to-opportunity around 10% to 12% (MarketJoy's B2B sales pipeline conversion data). These ranges aren't performance targets you should copy blindly. They provide a prompt to investigate whether your definitions, audience, offer, or handoff creates unusual friction.
A low visitor-to-lead rate points toward traffic quality, positioning, page experience, or offer relevance. A healthy capture rate with weak lead-to-MQL performance suggests loose targeting or an MQL definition that rewards activity rather than fit. A strong MQL count with poor MQL-to-SQL acceptance often indicates disagreement between marketing and sales.
Teams should also separate first-touch conversion from stage progression. A content download, consultation request, phone call, and proposal response represent different levels of intent. Reviewing B2B lead generation performance indicators can help establish a broader measurement vocabulary, but your own CRM definitions must remain the source of truth.
Industry Benchmarks and Channel Performance
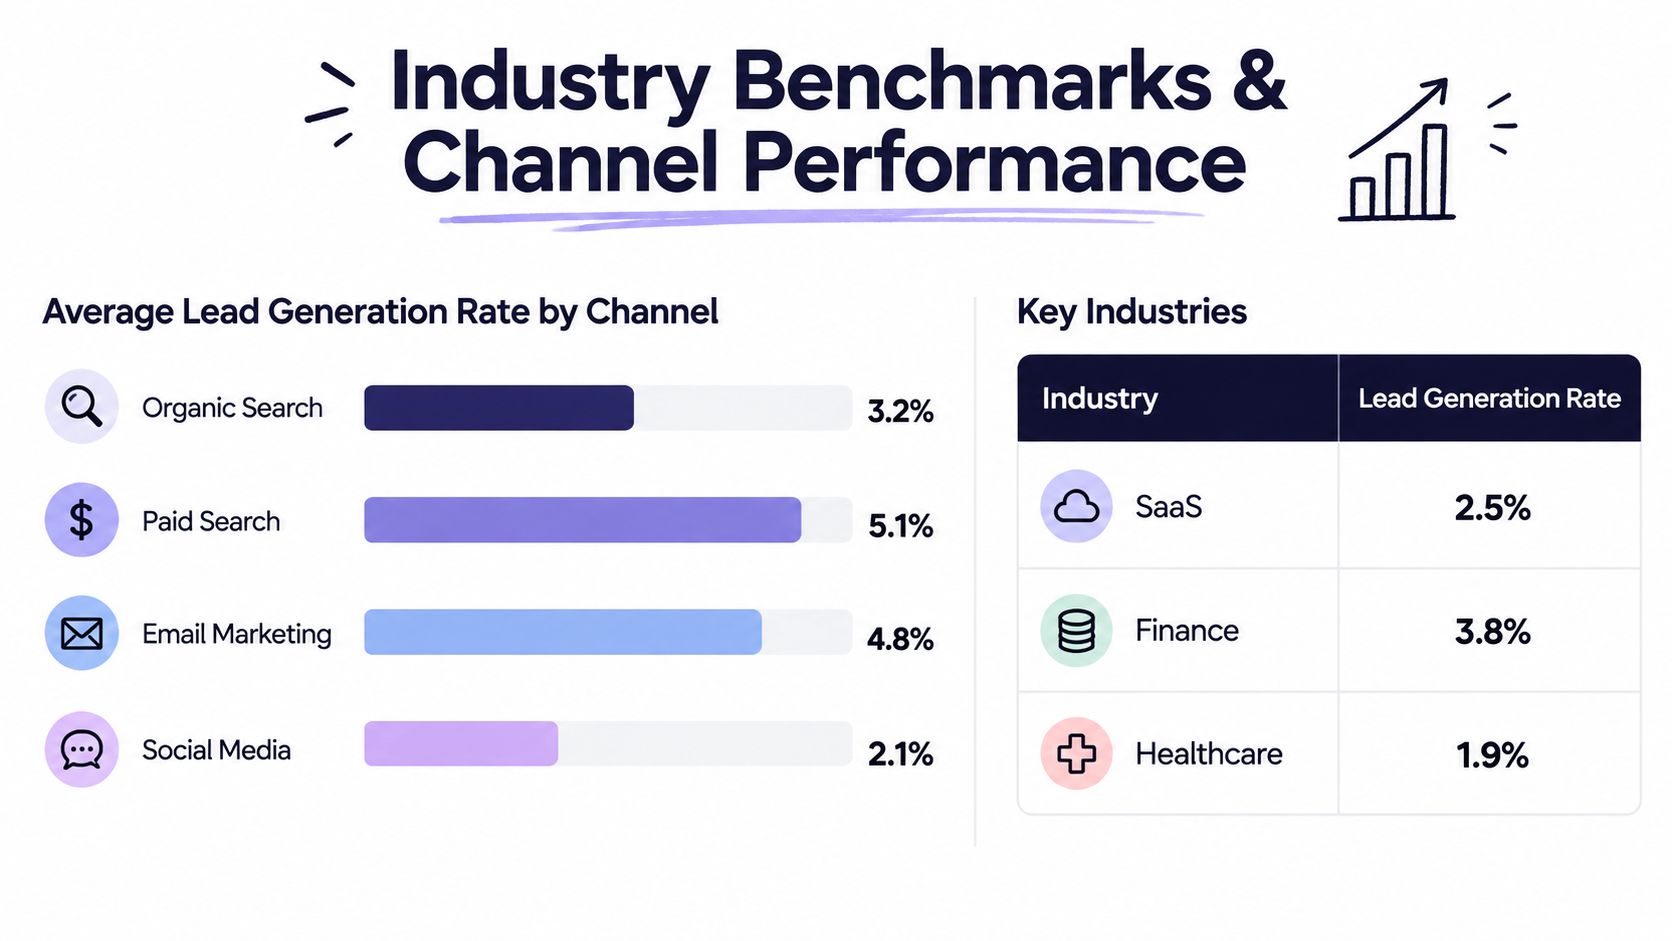
Channel comparisons become useful only when the conversion event is identical. A paid social campaign optimized for an early content interaction shouldn't be judged against a high-intent organic landing page that asks for a sales conversation. The source, audience, offer, buying stage, and follow-up process all influence the observed lead generation rate.
The 2026 channel benchmark cited by Callbox places median conversion at 2.6% for organic search, 2.4% for email, 1.5% for paid search, and 0.9% for paid social (Callbox's channel conversion benchmarks). These figures show relative differences in that dataset, not universal rules. Organic search may bring visitors with a defined problem, while paid social often reaches people earlier in their research.
Compare like with like
A channel with a lower top-of-funnel rate can still create better pipeline if its leads progress further. Conversely, a high capture rate can be expensive when sales rejects most submissions or when opportunities fail to close. Review conversion benchmarks for lead gen alongside your stage definitions, rather than treating any published average as a promise.
The phone-versus-form split deserves particular attention. The Piperocket analysis recorded a 5.13% average B2B lead conversion rate, alongside a 1.7% form conversion rate and a 1.2% call conversion rate, with phone accounting for roughly 40% of B2B conversions in the dataset (Piperocket's 2026 analysis). If your reporting counts forms but ignores calls, your lead generation rate may be understated.
Industry variation creates another trap. Benchmark coverage reports website visitor-to-lead rates ranging from 1.1% to 7.4% by vertical, with MQL-to-SQL around 13%, SQL-to-opportunity around 20% to 30%, and opportunity-to-close around 21% (SalesHive's B2B lead benchmarks). Those stage ranges reinforce the need to compare your funnel with similar markets and sales motions.
For a clearer view of progression, align channel reporting with your documented pipeline sales stages. Marketing should know which actions create accepted opportunities, not just which sources generate the largest contact list.
The Hidden Bottleneck of Response Latency
The form submission isn't the end of lead generation. It often marks the moment when the economic value of intent starts to decay. Teams spend weeks refining landing-page copy, then allow a new inquiry to sit in a shared inbox until someone notices it.
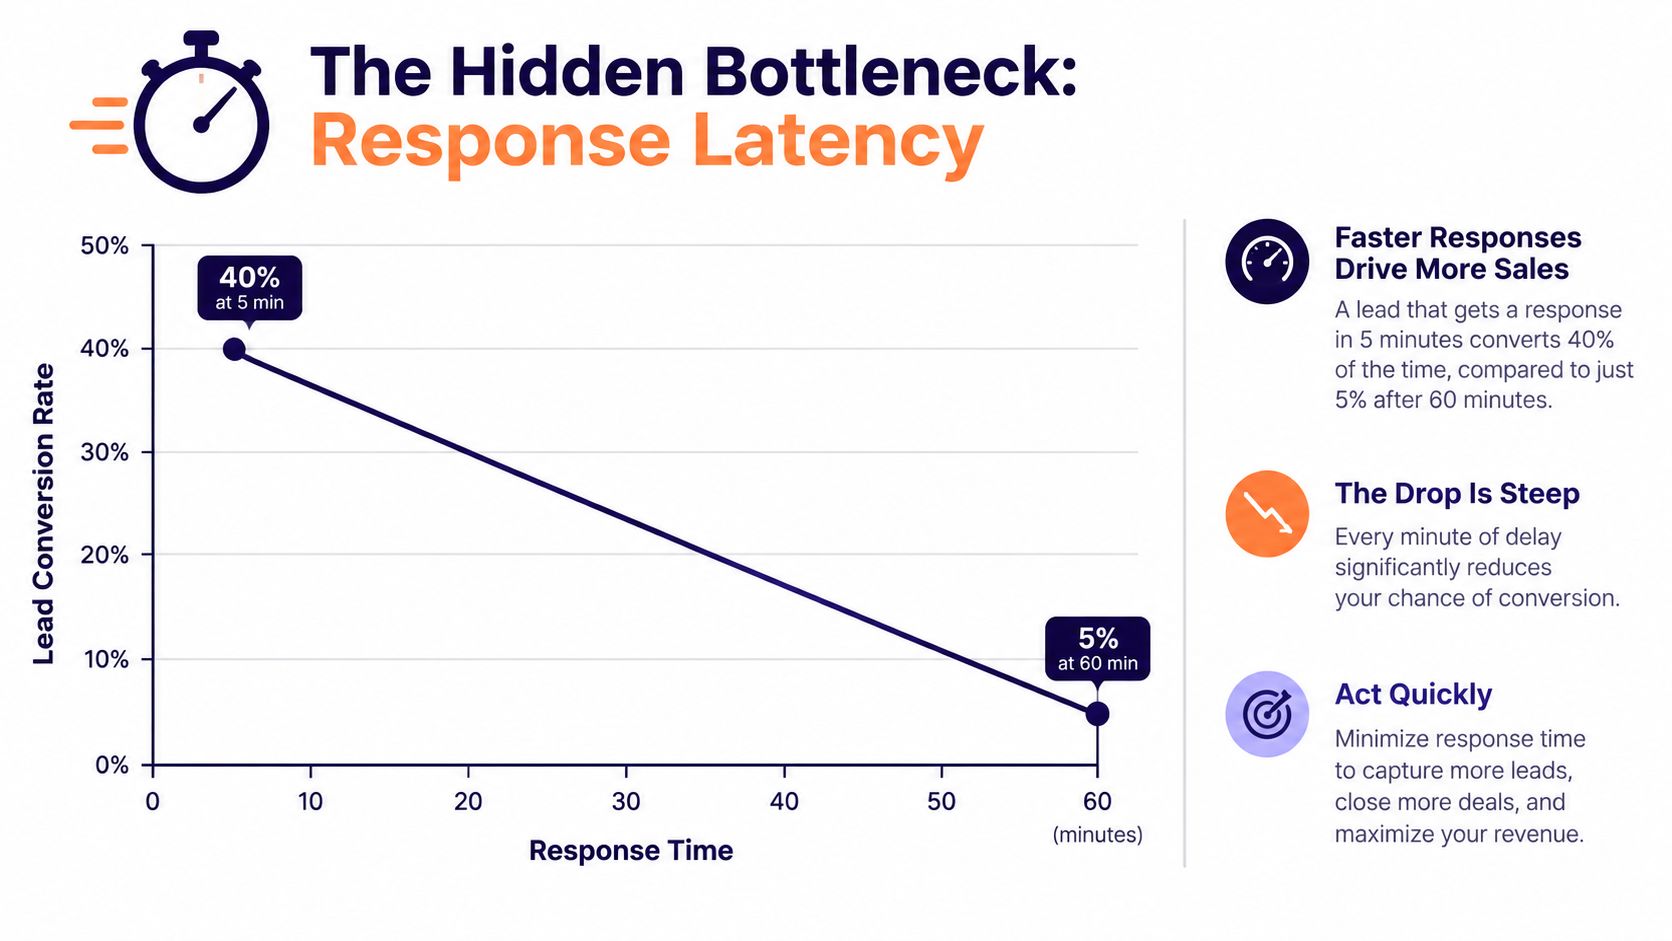
Aloware's benchmark reports that teams responding within five minutes convert at roughly 21%, while teams waiting a day or more convert at approximately 2.3% (Aloware's lead response time benchmarks). The same source reports a median B2B response time of about 42 hours, with only about 7% of teams replying within five minutes.
Why the first minutes matter
A slow reply changes the conversation. The buyer may contact another agency, lose urgency, become unavailable, or forget why they submitted the form. Your sales representative then has to recreate interest that was previously active.
A widely cited InsideSales benchmark reports conversion rates are more than 8x higher when a lead is attempted within the first five minutes rather than after five minutes to 24 hours (InsideSales response-time research). The precise result varies by channel, intent, offer, and team, but the operational lesson is stable. Response latency directly affects how much of your captured demand becomes usable pipeline.
Set service levels by intent. Industry guidance recommends responding to hot inbound leads in under five minutes, colder inbound inquiries in under 15 minutes, and achieving 95% or higher compliance with the response service level (Rework's lead response guidance). Measure actual first-response timestamps, not a team's stated intention to respond quickly.
The response-time report should sit beside the conversion report. A good landing page can't rescue an unmanaged queue.
Platform Specifics and Upwork Proposal Dynamics
On Upwork, the funnel begins before a prospect fills out a form. A posted project is a time-sensitive buying signal, and the proposal competes with other messages in the client's inbox. Lead generation rate therefore depends on proposal relevance, seller credibility, and how quickly the account moves from discovery to submission.
Proposal timing matters because the client's attention is finite. A well-written proposal sent after the client has reviewed several unsuitable responses may receive less consideration than a concise, personalized response that arrives while the brief is still fresh. Speed doesn't excuse generic copy, but strong personalization delivered late can still lose to adequate relevance delivered earlier.
Profile maturity changes the baseline
Upwork proposal performance benchmarks report interview-invitation response rates of 3% to 8% for new freelancers, 8% to 15% for established freelancers, 15% to 25% for experienced freelancers, and 25% to 40% for top-rated or expert-vetted sellers (Upwork proposal benchmarks by category). The ranges demonstrate why agencies shouldn't compare a new profile with a mature specialist account and conclude that proposal automation alone caused the difference.
A profile must make the proposal believable. Clear positioning, relevant samples, credible outcomes, and a focused service description reduce the amount of explanation required in each pitch. Automation can accelerate selection and drafting, but it can't manufacture proof that the profile doesn't contain.
For teams managing multiple bidders, create a controlled operating loop:
- Filter for fit: Define project types, budgets, technologies, industries, and red flags before searching.
- Prioritize intent: Separate urgent, well-scoped briefs from vague research requests.
- Personalize the opening: Address the client's actual problem rather than repeating a biography.
- Track the stages: Record viewed, replied, interviewed, and won outcomes separately.
- Review feedback: Use rejection and response patterns to adjust profiles and proposal logic.
Teams that want to reduce manual searching can also review how to automate Upwork proposals, especially when several accounts need consistent monitoring without copying the same message across every opportunity.
Scaling Speed and Quality with Earlybird AI
Lead response speed affects more than first contact. It can determine whether a qualified inquiry reaches a real conversation before interest fades. Human SDRs can write thoughtful replies, but continuous monitoring creates fatigue and inconsistent coverage. A practical setup assigns automation to detection, qualification prompts, first responses, and routine follow-up, while people handle judgment-heavy conversations.
The operating rule is straightforward: automate the delay, not the relationship. Approved positioning, project criteria, and account rules should guide the first response. A person must be able to take over when the client changes scope, asks a complex question, or raises a commercial concern.
What scalable automation should handle
Start with a defined ideal project and explicit exclusion rules. Previous proposal outcomes can refine which opportunities deserve attention. Profile details, relevant examples, and verified outcomes give the system material for a specific response rather than a generic pitch. Activity logs should separate proposal volume from replies, interviews, and qualified opportunities.
Earlybird AI connects with an Upwork account, learns preferred projects through feedback, searches for relevant jobs, drafts personalized proposals, and replies to client messages automatically. Its product information describes proposal submission in about 10 minutes of posting and replies in under five minutes. Teams should test those conditions against their account, workflow, and platform rules rather than treat them as a guaranteed result.
The same workflow can support AI for sales prospecting. Managers still need escalation rules, outcome reviews, and accurate claims. Automation improves speed, but generic proposals and unsupported promises can reduce reply quality as volume increases.
Quality control belongs in the workflow. Require approval for unusual scopes, sensitive claims, pricing discussions, and any message that could create a commitment.
Set clear boundaries for account access and client communication. Use approved methods, avoid misleading behavior, preserve human oversight, and monitor whether response quality holds as activity grows. Speed only creates value when the next stage receives a relevant, credible conversation.
A short demonstration can help stakeholders see how discovery, proposal drafting, and reply handling connect:
Building a Sustainable Pipeline Strategy
A sustainable pipeline doesn't begin with a larger traffic target. It begins with a clear map of the existing funnel and an honest view of where prospects stop moving.
An agency owner can audit the system in one working session by asking five questions:
- Capture: Which actions count as a lead, and are calls included alongside forms?
- Qualification: What makes a lead an MQL or SQL, and does sales agree?
- Routing: Who owns a new inquiry, and what happens outside working hours?
- Response: Can the team prove first-touch timing from CRM or platform records?
- Progression: Which stage loses the largest share of qualified prospects?
The answers should produce a small set of stage-specific rates, not one impressive dashboard number. Track visitor-to-lead, lead-to-MQL, MQL-to-SQL, SQL-to-opportunity, and opportunity-to-close separately. Pair each rate with response latency and source quality so a channel isn't rewarded for leads that never become useful conversations.
A practical operating rhythm
Review the funnel by cohort and channel. Identify one friction point, change one process or asset, and watch the downstream stage rather than celebrating a rise in raw submissions. If the bottleneck is response time, add routing and automation before increasing acquisition spend. If qualification is weak, refine the offer, targeting, or handoff criteria.
The goal is a pipeline that behaves predictably under normal demand. Agencies that protect response speed, define stages clearly, and judge channels by qualified progression can grow without turning every new lead into another manual task.
Earlybird AI helps Upwork agencies and freelancers automate job discovery, personalized proposal drafting, client replies, and follow-up while keeping performance visible through lead-related analytics. Visit Earlybird AI to see how an always-on workflow can reduce response latency and help your team convert more of the opportunities it already earns.