

← Back To Blog
Opportunity Analysis Example: Scorecard and Worked Math
You've got a team with room for more work, two promising services to sell, and a familiar problem: marketplace searches suggest demand, but they don't tell you which opportunity your agency can win profitably. A large category can still be a poor bet if your proposals get ignored, the work doesn't fit your team, or delivery consumes the margin.
A useful opportunity analysis example starts with your own sales process. The worked scenario below compares two offers using illustrative assumptions. Replace every assumed rate and time estimate with your agency's proposal and delivery history before making a capacity decision.
Worked Opportunity Analysis Example With Expected Value Math
A four-designer agency has 40 spare hours per week and must choose between Shopify landing page redesigns for mid-market brands, Opportunity A, and AI-generated product video ads for direct-to-consumer brands, Opportunity B. Its current personalized-bid reply rate is about 10%, and the team wants to protect a 40% target margin. Those figures are scenario assumptions, not universal benchmarks. The agency should replace them with its own results.
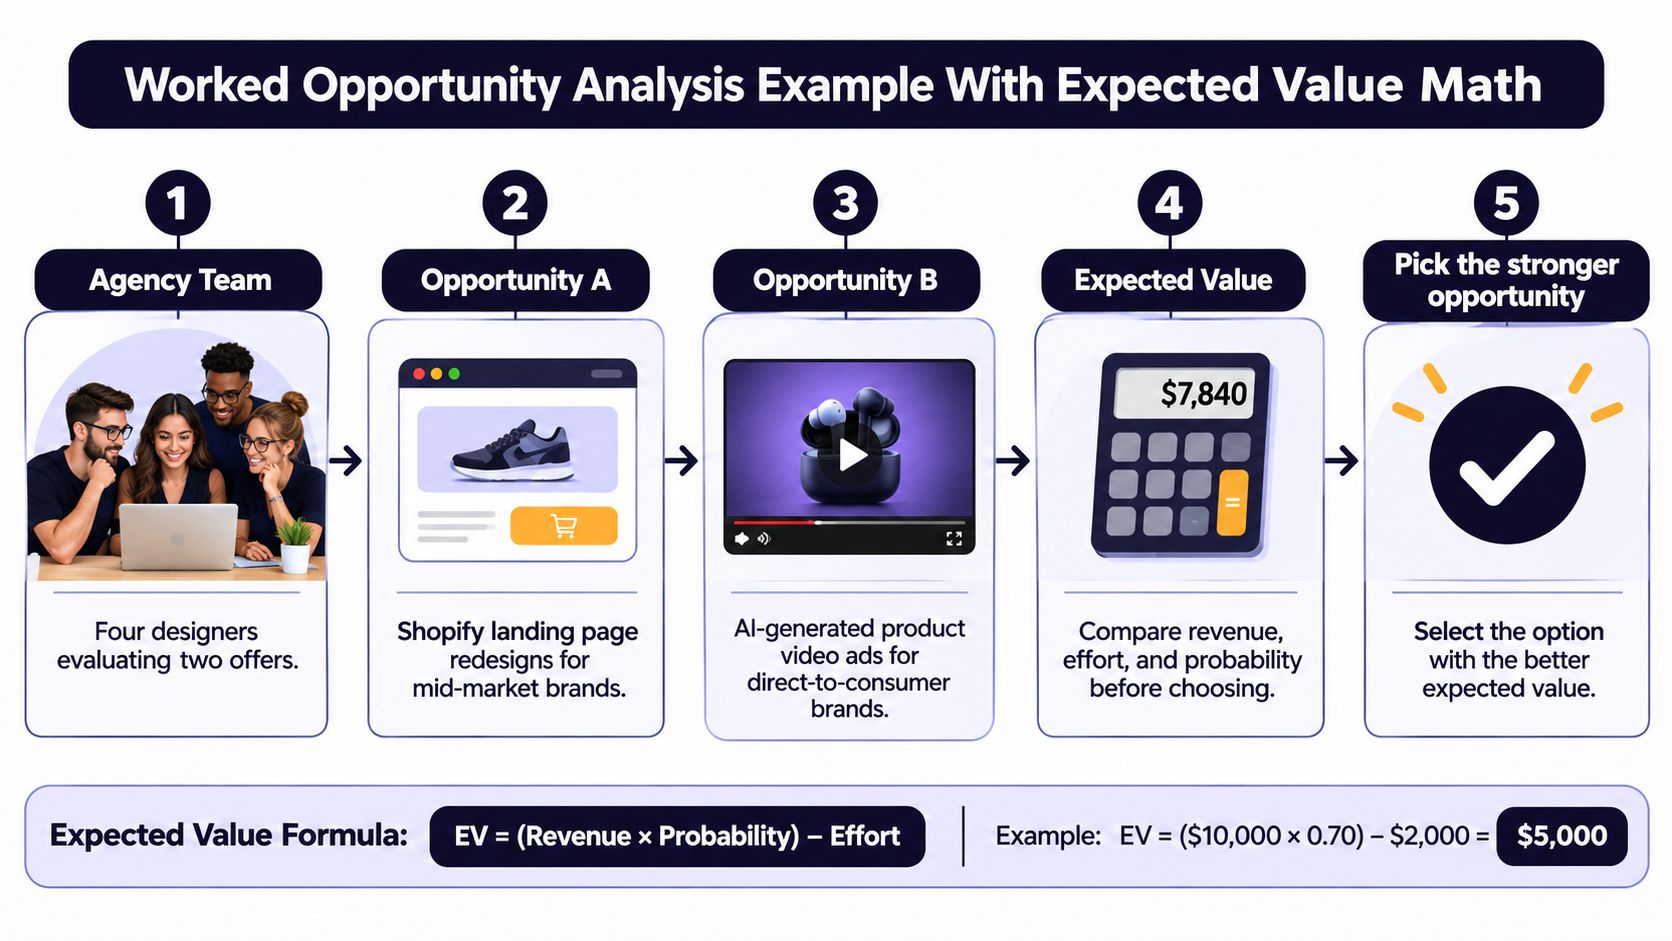
Six stages, from buyer need to decision
1. Define each opportunity in buyer language. Opportunity A isn't “Shopify design.” It's a clearer, higher-converting landing page for a mid-market brand whose current store makes it hard for shoppers to understand the product or complete a purchase. Opportunity B isn't just “AI video.” It's a set of product ads a direct-to-consumer brand can use to test creative concepts and promote products.
This distinction matters when you assess your market potential. Sprints & Sneakers' guide to assessing market potential is a useful companion for turning a broad idea into a testable commercial proposition.
2. Size the reachable pool. Don't count every business that might buy either service. Count the postings your agency can serve, with the skills, proof, and working hours it has. Then narrow further to buyers with a plausible budget and a project scope your team can complete well.
3. Score demand and fit. For each offer, review saved searches and recent postings. Look for specific buyer problems, repeated budget language, relevant portfolio examples, and work the team can deliver without overloading its schedule. A category can have plenty of postings and still be a weak fit if the buyer expects a capability the agency can't demonstrate.
4. Estimate reply and win rates. Use the agency's own proposals, separated by offer type and buyer segment. For now, assume Opportunity A gets a 10% reply rate and wins 25% of replies. Assume Opportunity B gets a 6% reply rate and wins 15% of replies. These are illustrative assumptions to replace with at least 30 days of your own proposal history.
As a directional comparison, a secondary compilation reports roughly 2–5% reply rates for template-based proposals and 8–30% for personalized proposals. Those figures aren't a primary Upwork platform dataset, so treat them as context, not a forecast, and use your measured proposal outcomes to set your own baseline.
5. Calculate expected value per proposal. Use one formula: expected value per proposal = reply rate × win rate after reply × average project value × margin.
For Opportunity A, use an illustrative $3,000 project value, 10% reply rate, 25% win rate after reply, and 40% margin: 0.10 × 0.25 × $3,000 × 0.40 = $30 per proposal.
For Opportunity B, assume a $1,500 project value, 6% reply rate, 15% win rate, and 55% margin: 0.06 × 0.15 × $1,500 × 0.55 = about $7.43 per proposal. B has a higher assumed margin, but its lower proposal response and win probabilities outweigh that advantage.
Now test whether a better pitch changes the result. If B's reply rate rises from 6% to 9%, with its other assumptions unchanged, the result becomes 0.09 × 0.15 × $1,500 × 0.55 = about $11.14 per proposal. To match A's $30, B would need a reply rate of about 24%, holding its other assumptions constant. That's a useful target for testing, not a claim that the agency will achieve it.
6. Check risks and capacity. Expected value only helps if the team can fulfill the work. For a capacity illustration, assume each proposal takes half an hour, an A project takes 20 delivery hours, and a B project takes 12 delivery hours. For every 100 proposals, A would produce an expected 2.5 wins under the assumptions above, using about 50 proposal hours plus 50 delivery hours. B would produce an expected 0.9 wins, using about 50 proposal hours plus 10.8 delivery hours.
That gives an expected labor load of about one hour per A proposal and 0.608 hours per B proposal, including the probability-weighted delivery time. With 40 spare hours, the agency could send about 40 A proposals or 65 B proposals under these assumptions. The greater proposal volume for B doesn't erase its lower expected value per proposal. The agency should compare both return and workload, then check whether delivery time is available when projects land.
A simple funnel shows where to improve first. For A, 100 proposals at a 10% reply rate produce 10 replies. If half become shortlists, that's five shortlists; if half of those become wins, that's 2.5 expected wins, consistent with a 25% win rate after reply. Track each stage separately. If proposals get replies but few shortlists, improve proof or qualification; if shortlists don't turn into wins, work on scoping, pricing, or the sales conversation. The verdict in this illustrative case is that A wins on expected value per proposal. B needs a much higher reply rate to justify its effort.
Sizing Your Reachable Market From TAM to SOM
An agency can serve only a fraction of the buyers included in a broad market estimate. The TAM–SAM–SOM framework separates those layers: total addressable market (TAM) is the full revenue opportunity, serviceable addressable market (SAM) is the share that fits your services and operating limits, and serviceable obtainable market (SOM) is the portion you can realistically win. Market-sizing guides commonly use this logic to distinguish total opportunity from reachable customers and a near-term target.

For a design agency, TAM could include all client spending on freelance design and development. SAM narrows that pool to buyers posting on Upwork, hiring in the agency's categories, working within serviceable time zones, and offering budgets that make sense. SOM reflects the share the agency can pursue and deliver with its current proposal volume, sales process, and capacity.
Upwork reported 832,000 active clients at the end of 2024. That platform-wide figure provides context, not a count of buyers seeking a particular design service or a forecast of agency revenue, as Upwork's 2024 financial results show.
To estimate a reachable pool, filter that client base by category relevance, budget fit, and serviceable region. For illustration, suppose the agency estimates that 10% of clients fit its categories, 20% of those fit its budgets, and 50% are in regions it can serve. The result is a working pool of 8,320 clients. These filter shares are assumptions, not evidence of current hiring activity; replace them with saved-search and buyer data. A target-market segmentation framework can help structure the filters, while teams can use buyer data to improve outreach by recording which searches produce relevant postings, qualified conversations, and wins.
The same method applies to an agency-automation product: define the broader group buying lead-generation or sales-support services, narrow it to businesses using Upwork, then estimate the portion the product can reach with its current capabilities, sales capacity, and geographic coverage.
Set SOM as an operating target, such as the number of qualified opportunities the team can pursue and fulfill over a defined period. Base that target on observed demand and available capacity, then revise it when either changes.
Scorecard Template for Agencies and Freelancers
A big market and a long competitor list don't reveal whether your team can respond fast, personalize a proposal, or prove that it can deliver. A scorecard makes those factors visible and gives the team a record it can revisit instead of relying on a founder's instinct. A 2022 study of 316 newly established SMEs in Pakistan found that opportunity recognition partly mediated the relationship between entrepreneurial orientation and new-venture performance. The practical point is that identifying and evaluating opportunities is a business capability, not just brainstorming.
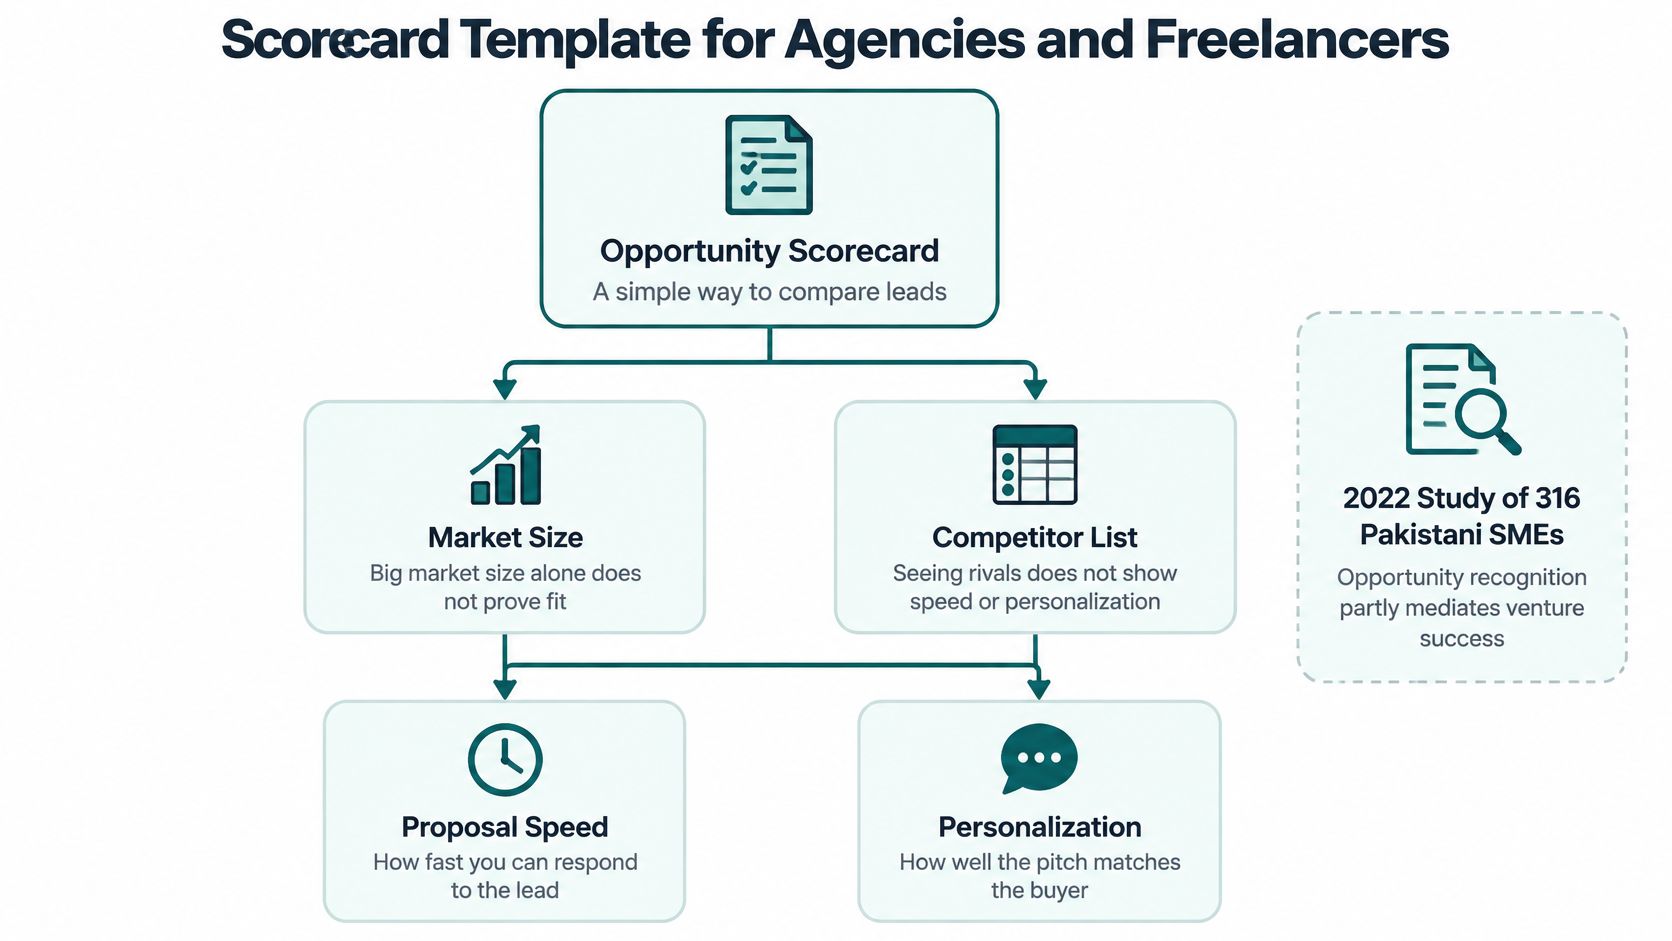
Use these eight criteria, with weights that total 100:
- Demand growth, 15 points: Review saved-search volume over the past 90 days. Separate an increase in relevant postings from a rise in broad, poorly qualified keywords.
- Buyer urgency and budget signals, 15 points: Look for clear deadlines, defined deliverables, and budget language that matches the agency's minimum viable project.
- Portfolio fit, 15 points: Count relevant portfolio pieces and check whether they demonstrate the exact service and outcome the buyer wants.
- Probability of a reply, 15 points: Calculate this from your team's proposals over the last 30 days, grouped by offer and buyer type.
- Probability of winning, 10 points: Measure wins as a share of replies, and note whether a weak result comes from pricing, proof, or sales follow-through.
- Delivery capacity and turnaround, 10 points: Check team availability against the expected workload and buyer's requested schedule.
- Expected margin, 10 points: Estimate margin after delivery time, revisions, and the work required to manage the client.
- Account or compliance risk, 10 points: Identify any risk tied to the platform account, proposal method, or client requirements before submitting.
Score each criterion from 1 to 5, multiply the rating by its weight, then divide by 5. A score of 4 on a criterion weighted at 15 contributes 12 points. Add the weighted contributions for a score out of 100. As a working decision rule, treat totals above 70 as pursue, 50 to 70 as test, and below 50 as pass. These are agency-set thresholds, not universal cutoffs.
Record the evidence beside each rating. A low fit score should point to missing portfolio proof; a weak reply score should lead to a proposal review, not a vague instruction to “improve sales.” For a practical way to structure a competitor comparison, use this competition analysis table. Re-score opportunities when your saved searches or delivery capacity change, rather than treating one completed scorecard as a permanent verdict.
Separating Durable Demand From AI Hype
An AI label can make a project category look hotter than the underlying buyer need. A client may use "AI content" in a posting but in fact need finished video, reliable quality assurance, or a workflow that connects existing tools. The better test is whether buyers repeatedly pay for a measurable deliverable, not whether a technology appears in a search phrase.

Marketplace signals show why it's worth separating those ideas. Upwork reported that demand for skills explicitly referencing AI grew 109% year over year, while full-stack development, virtual assistance, and graphic design remained strong; in June 2026, AI Apps & Integration grew 34% month over month and 33% year over year, and searches for defined outputs such as AI UGC video and AI video ads rose faster than broader phrases such as “AI image” and “AI content creator,” according to Upwork's in-demand jobs and skills report. These measures describe marketplace demand signals, not the budgets or margins available to your agency.
Run three checks on your own saved searches:
- Deliverable or tool: Do clients describe a result they need, such as finished product ads or integrated workflows, or only name a tool? Deliverable language is easier to scope, price, and prove.
- Repeated budget language: Do postings in the same niche repeatedly describe budgets and scopes your team can serve? A trending keyword without a workable budget is a weak sales opportunity.
- Returning buyers: Does the same buyer post again within 90 days? Repeat postings can indicate an ongoing need, though you still need to confirm fit, scope, and profitability.
Then score the opportunity using demand growth, urgency, portfolio fit, reply likelihood, win likelihood, delivery capacity, margin, and risk. A fast-growing keyword may deserve a test, but it doesn't deserve a full team commitment by itself.
A short visual walkthrough can help your team discuss how to separate the technology label from the deliverable the buyer wants:
Replace “Is this market growing?” with a more useful question: Which project language, buyer problem, and measurable deliverable show an opportunity worth pursuing?
Risk Checks and When to Walk Away
A high score doesn't excuse a project your team can't deliver. Before committing proposal time, define risk limits that make sense for your agency and treat them as decision rules, not fine print.
Delivery risk: Pass if the project requires a skill your portfolio and team can't support. Also pass when the requested turnaround is shorter than your team's normal delivery time and you can't reduce scope or add qualified capacity. A strong expected-value estimate doesn't fix a capability gap.
Client concentration: Set a maximum share of revenue you're willing to depend on from one buyer. For example, an agency might flag any client expected to exceed 30% of revenue and require a plan to diversify before adding more work. That's a sample policy threshold, not a market benchmark.
Account and compliance risk: Pass on proposals that would break platform rules. Don't use a bidding approach that depends on misleading claims or indiscriminate copying. If the team can't personalize a proposal at the required pace, lower the volume instead of risking account standing.
Margin erosion: Flag scope that can expand after the first milestone without a change in fee. Define deliverables, revision limits, and acceptance criteria before work starts. If the buyer won't agree to a workable scope, walk away or reprice.
Add three warning signs to the scorecard: budgets expressed only as open-ended hourly ranges with no scope; requests for free samples beyond the limit your agency sets; and postings that appear repeatedly across many agencies. These signals don't prove a buyer is unsuitable, but they call for stronger qualification before investing time.
For a second opinion on a new offer, quick tests for new business concepts can help turn a promising claim into a small, testable commitment. Keep your margin assumptions grounded in your own delivery costs, and use this guide to review advertising agency profit margins as part of that check.
- Override rule: Any serious risk flag overrides a total score above 70.
- Downgrade rule: Two or more risk flags move a test opportunity to pass until the agency resolves them.
Confirm Your Scorecard Before Committing Capacity
A scorecard is a decision aid, not a substitute for a real test. Before you redirect your team toward a new offer, use actual postings and a small amount of measured outreach to challenge the assumptions behind your ranking.
Score two or three real opportunities. Pull postings from saved Upwork searches and rate each one against the eight criteria. Keep notes on the project language, budget, buyer, and portfolio evidence so the next reviewer can understand why you gave each rating.
Calculate expected value per proposal. Use your own reply and win rates wherever possible. Keep the assumptions visible, especially when a category is new and your sample is small. Don't treat an optimistic margin estimate as a reason to skip delivery-cost checks.
Run a limited test. Send 20 to 30 personalized proposals for the highest-scoring opportunity and track replies and wins for 30 days. Record the stages separately, including whether a reply became a shortlist and whether the agency won the work. The small test won't answer every question, but it can show where the funnel is breaking before you commit more capacity.
Replace the assumptions and rerank. Put the measured reply, win, and delivery figures into the worked calculation. Then compare the revised expected value and workload against the other opportunities. Make one of three decisions after 30 days: keep the opportunity, adjust the targeting or pitch, or drop it.
For teams handling high proposal volume, Earlybird AI is one optional Upwork automation platform. During setup, a customer marks real jobs they would and wouldn't apply to so the system can learn their niche; prospects can also use a Book a Demo option to see the workflow of finding jobs, sending proposals, and booking calls live on their own Upwork account. The scorecard works with or without automation. The important part is to measure whether the agency can identify, win, and fulfill the opportunity profitably.
Earlybird AI helps agencies find and qualify relevant Upwork jobs, learn from the projects they choose, and send personalized proposals as part of an automated outreach workflow. If you're weighing proposal volume against fit and capacity, visit Earlybird AI to see how the workflow could support your opportunity analysis.


